Fig. 3.
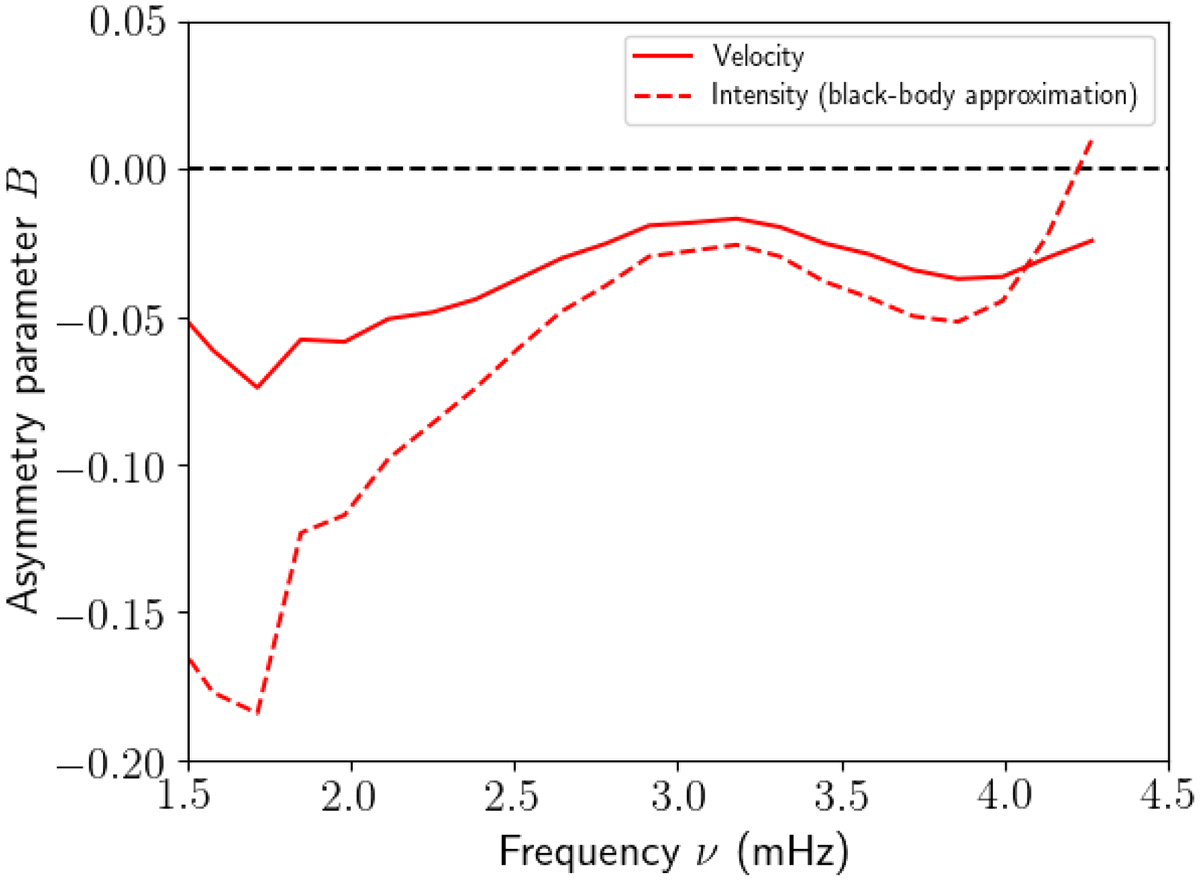
Predicted asymmetry profiles B(ν) when the relation δTeff = δT is assumed. The solid red line shows the velocity asymmetries (since they are unaffected by the intensity fluctuation modelling, it is identical to the solid blue line in Fig. 2). The dashed red line corresponds to the intensity asymmetries obtained by using Eq. (27) in place of Eq. (20).
Current usage metrics show cumulative count of Article Views (full-text article views including HTML views, PDF and ePub downloads, according to the available data) and Abstracts Views on Vision4Press platform.
Data correspond to usage on the plateform after 2015. The current usage metrics is available 48-96 hours after online publication and is updated daily on week days.
Initial download of the metrics may take a while.