Fig. 9.
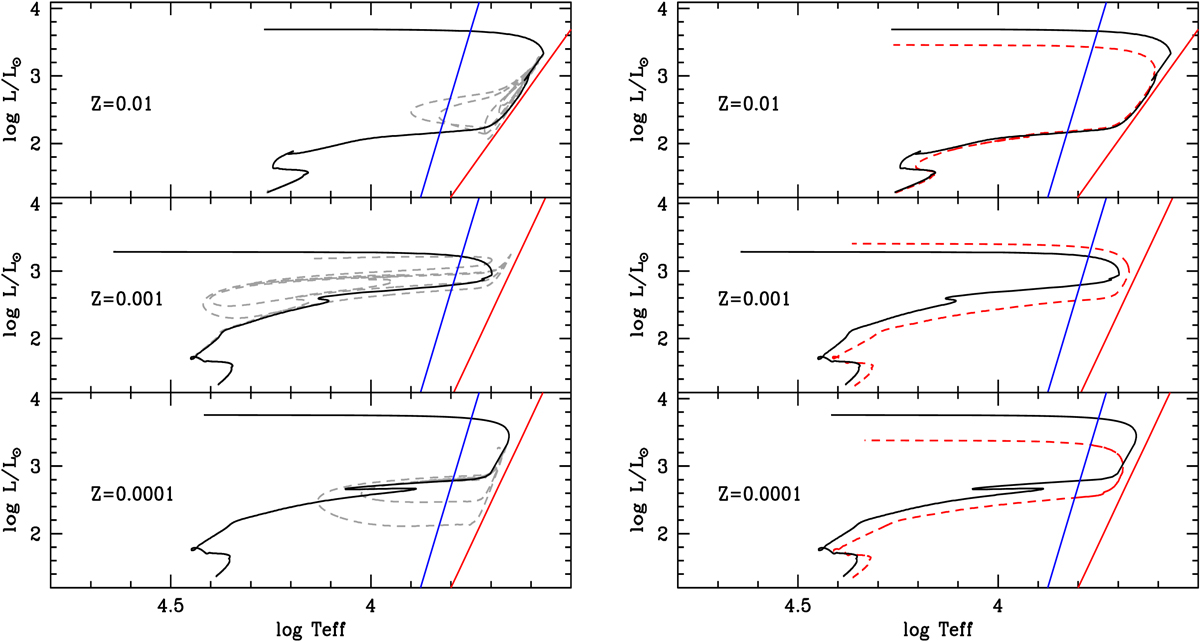
Left: HRD of HB models crossing the instability strip, calculated by assuming an analytical extension for the AGB evolutionary phases (black solid lines) and HB models with the same stellar mass with a full evolutionary computation (black dashed line). From top to bottom: theoretical predictions refer to metal-rich (M = 0.505 M⊙), metal-intermediate (M = 0.505 M⊙), and metal-poor (M = 0.520 M⊙) models. The almost vertical blue and red lines display the edges of the instability strip. Right: same as the left panel, but the comparison is between standard He (black solid line) and He-enhanced (Y = 0.30) models (black dashed lines). See text for details.
Current usage metrics show cumulative count of Article Views (full-text article views including HTML views, PDF and ePub downloads, according to the available data) and Abstracts Views on Vision4Press platform.
Data correspond to usage on the plateform after 2015. The current usage metrics is available 48-96 hours after online publication and is updated daily on week days.
Initial download of the metrics may take a while.