Fig. 7.
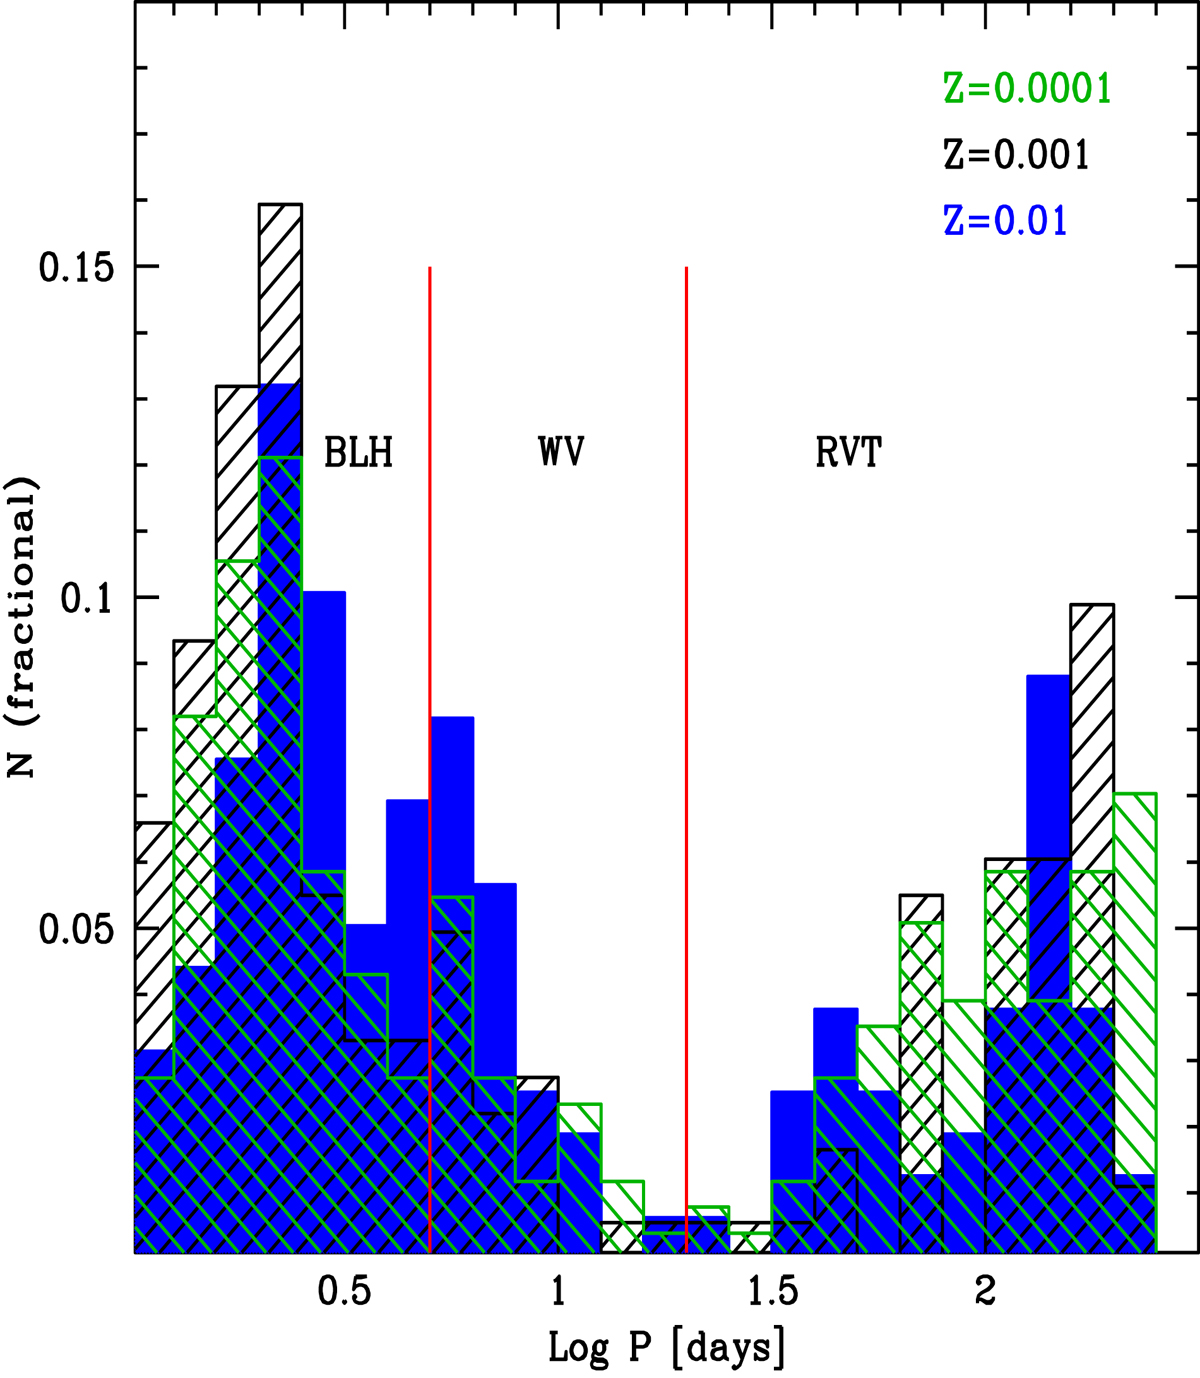
Predicted period distributions for TIICs with different chemical compositions (see legend for colour-coding). Results are based on synthetic HB models (see Fig. 5) calculated by assuming a uniform mass distribution along the HB. The two vertical red lines give the boundaries at 5 and 20 days, respectively. The different sub-groups of TIICs are also labelled.
Current usage metrics show cumulative count of Article Views (full-text article views including HTML views, PDF and ePub downloads, according to the available data) and Abstracts Views on Vision4Press platform.
Data correspond to usage on the plateform after 2015. The current usage metrics is available 48-96 hours after online publication and is updated daily on week days.
Initial download of the metrics may take a while.