Fig. 5.
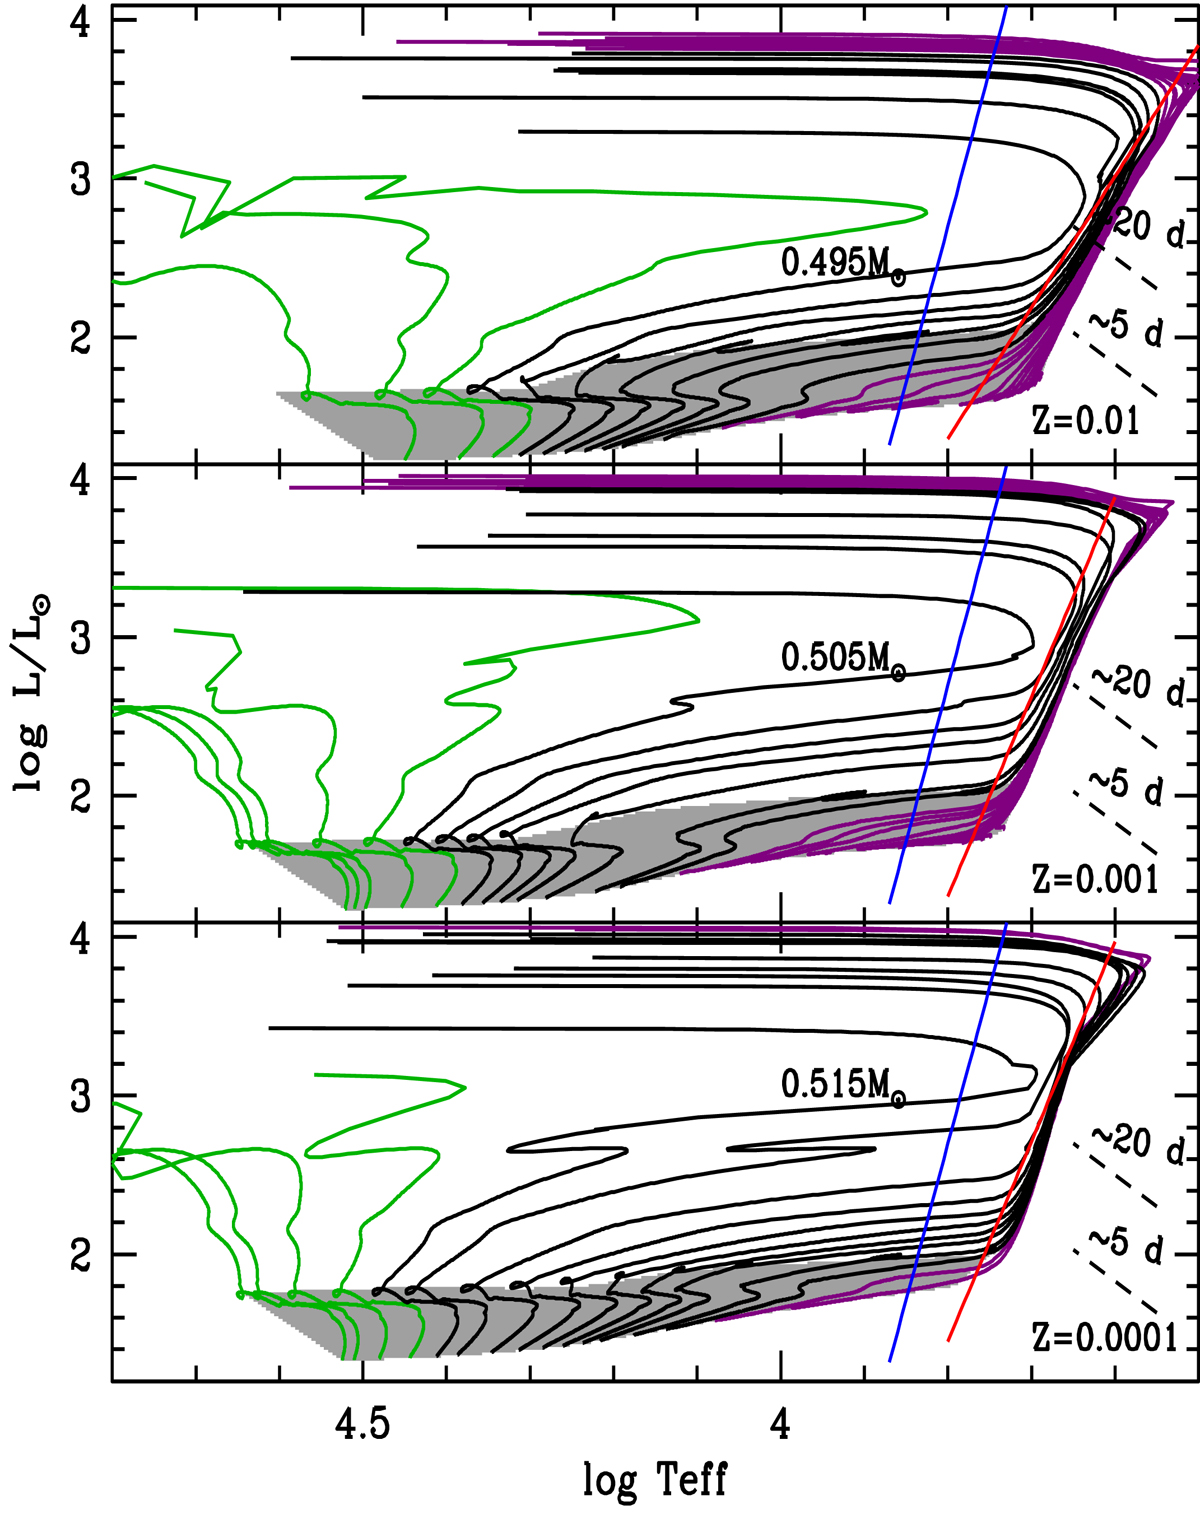
Top: HRD of HB evolutionary models covering a broad range of stellar masses (M/M⊙ = 0.48−0.90) and the same initial chemical composition (Z = 0.01, Y = 0.259). The grey area outlines the region between ZAHB (faint envelope) and central helium exhaustion (bright envelope). The green lines display HB models evolving as AGB-manqué, black lines the post early-AGB models, and purple lines the thermal pulsing AGB models (see text for details). The almost vertical blue and red solid lines indicate the hot and cool edges of the Cepheid instability strip. The minimum stellar mass (in solar units) crossing the instability strip is labelled in black. The black dashed lines show two iso-periodic lines for 5 and 20 days. Middle: same as the top panel, but for stellar masses ranging from M/M⊙ = 0.4912 to 0.80 and for a metal-intermediate chemical composition (Z = 0.001, Y = 0.246). Bottom: same as the top panel, but for stellar masses ranging from M/M⊙ = 0.5035 to 0.70 and for a metal-poor chemical composition (Z = 0.0001, Y = 0.245).
Current usage metrics show cumulative count of Article Views (full-text article views including HTML views, PDF and ePub downloads, according to the available data) and Abstracts Views on Vision4Press platform.
Data correspond to usage on the plateform after 2015. The current usage metrics is available 48-96 hours after online publication and is updated daily on week days.
Initial download of the metrics may take a while.