Fig. 4.
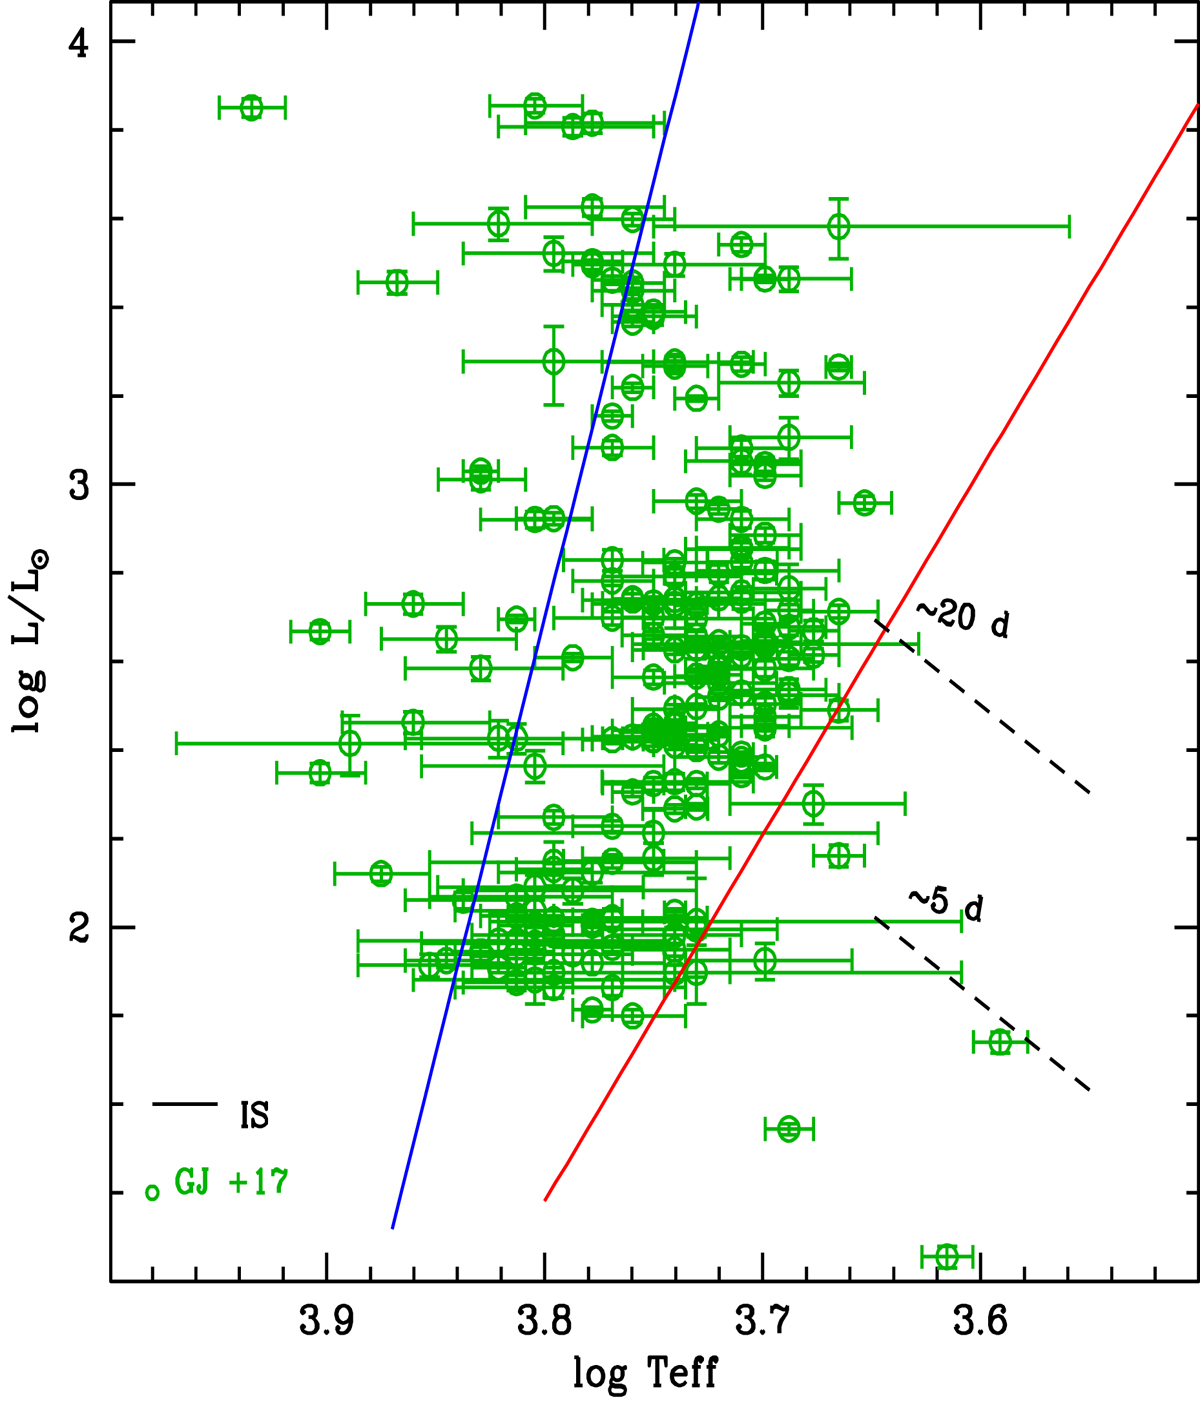
Hertzsprung-Russell diagram comparing the predicted edges of the instability strip and observations for Magellanic TIICs (blue and red solid lines) by Groenewegen & Jurkovic (2017a,b). The horizontal error bars display the uncertainty in effective temperature. The black dashed lines are the iso-periodic lines for 5 and 20 days.
Current usage metrics show cumulative count of Article Views (full-text article views including HTML views, PDF and ePub downloads, according to the available data) and Abstracts Views on Vision4Press platform.
Data correspond to usage on the plateform after 2015. The current usage metrics is available 48-96 hours after online publication and is updated daily on week days.
Initial download of the metrics may take a while.