Fig. 2.
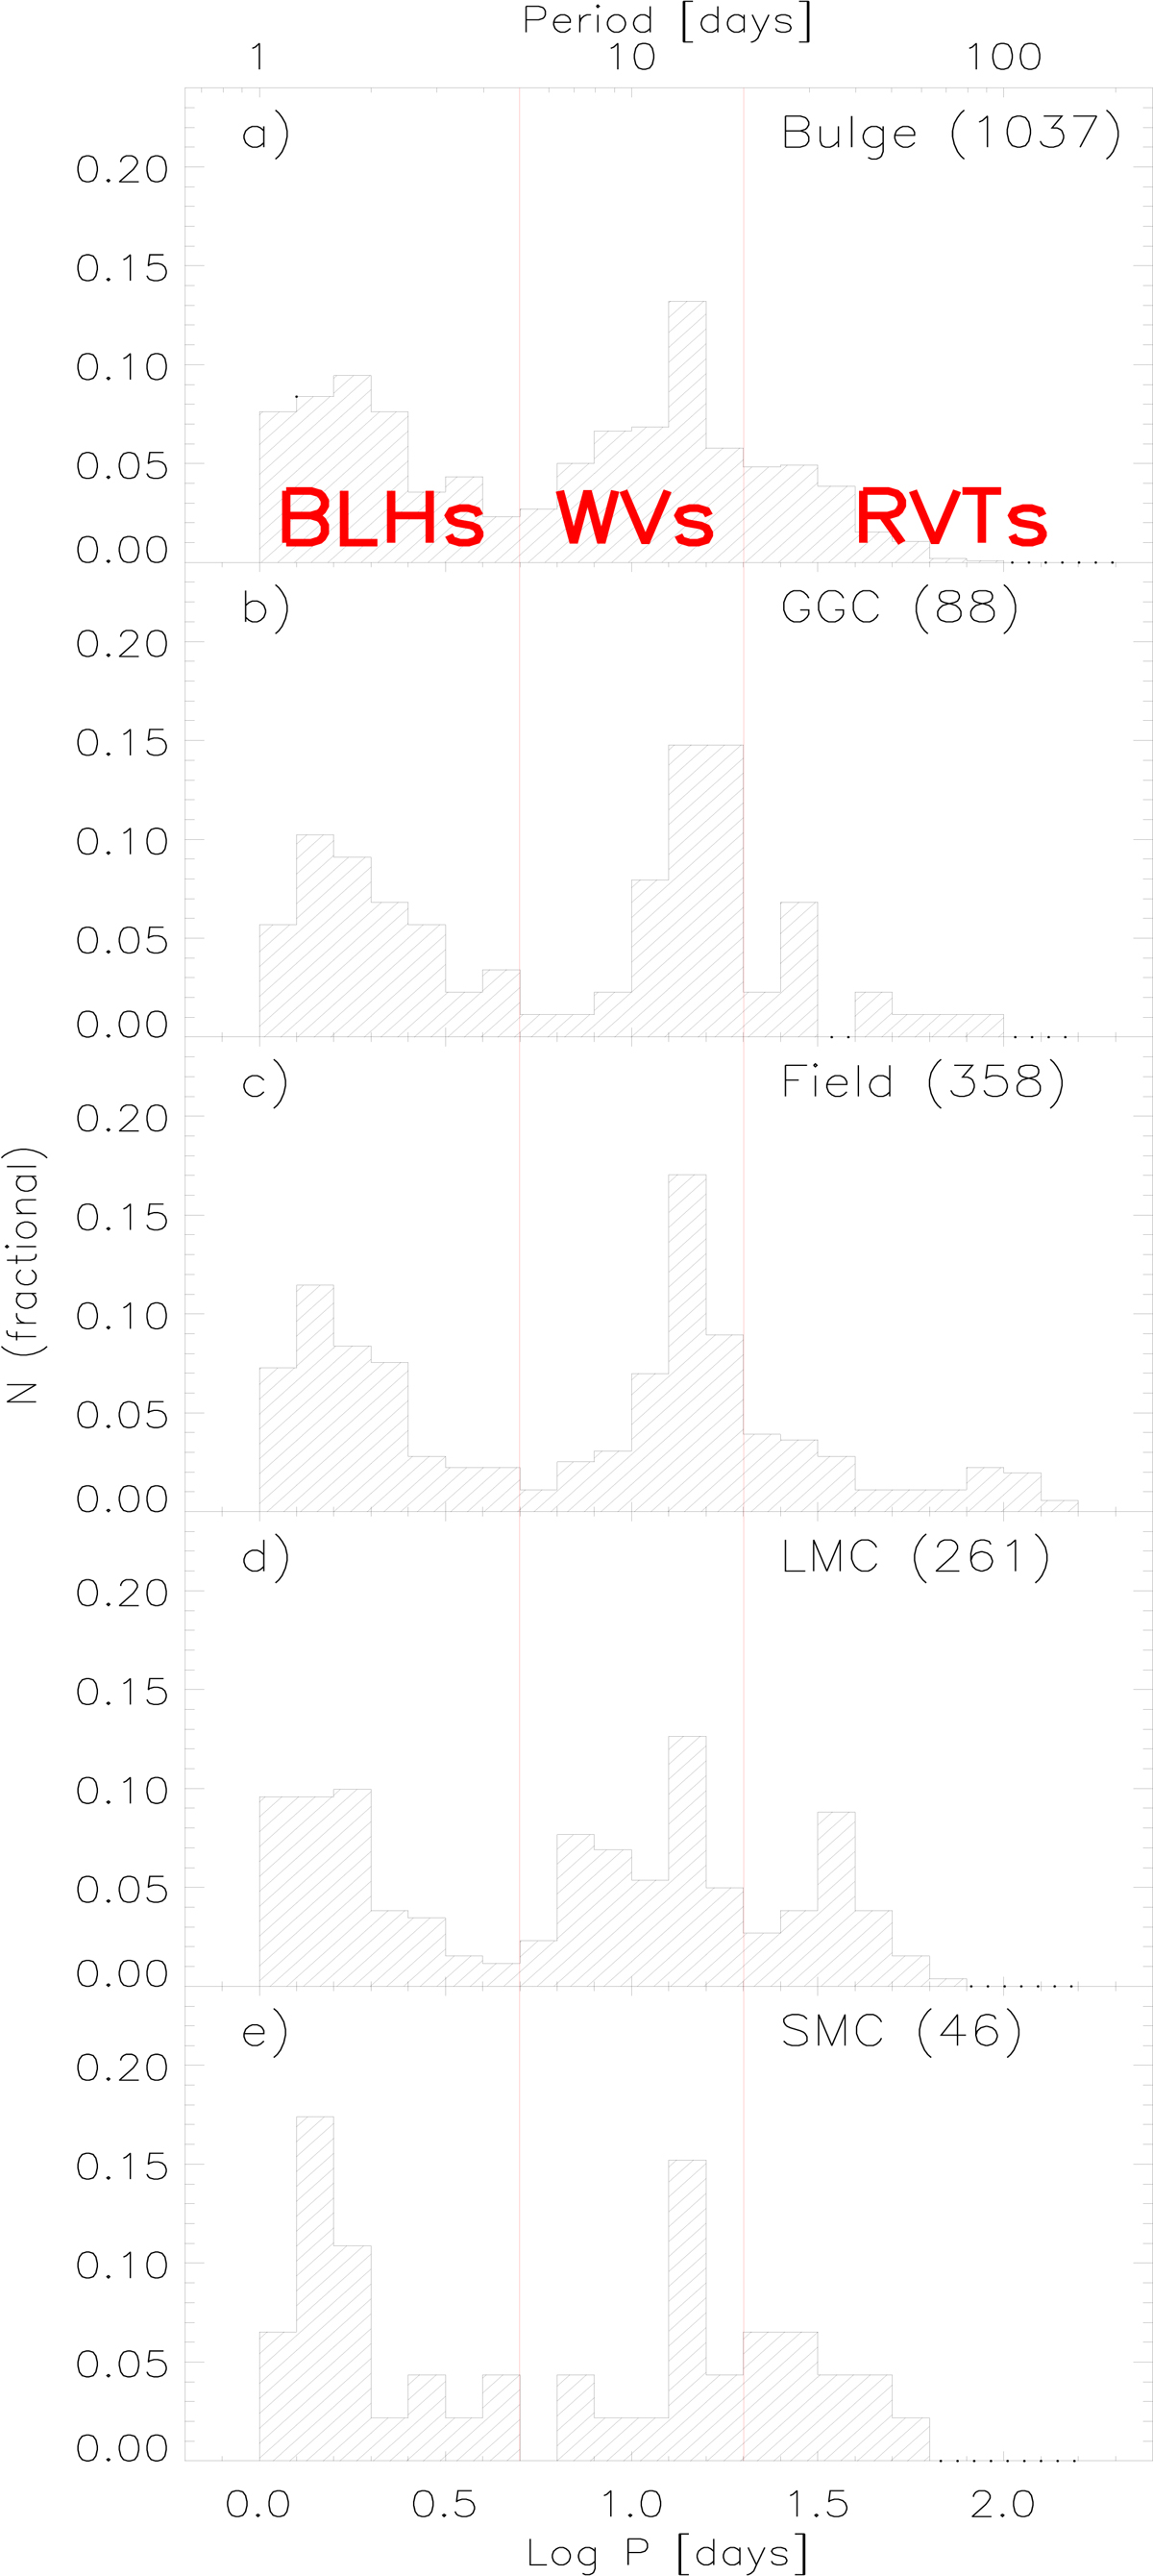
Panel a: period distribution for TIICs in the Galactic Bulge (OGLE-IV, Soszyński et al. 2017). The two red vertical lines give the period boundaries, according to Soszyński et al. (2011), for the three sub-groups: BLHs (P ≤ 5 days), WVs (5 < P ≤ 20 days), and RVTs (P > 20 days). The total number of TIICs and the number fractions of the three sub-groups are also labelled. Panel b: same as panel a, but for TIICs in Galactic globular clusters according to Clement et al. (2001), Matsunaga et al. (2006), Pritzl et al. (2003). Panel c: same as panel a, but for TIICs in the Galactic field according to Ripepi et al. (2019). Panel d: same as panel a, but for TIICs in the Large Magellanic Cloud according to Soszyński et al. (2018). Panel e: same as panel a, but for TIICs in the Small Magellanic Cloud according to Soszyński et al. (2018).
Current usage metrics show cumulative count of Article Views (full-text article views including HTML views, PDF and ePub downloads, according to the available data) and Abstracts Views on Vision4Press platform.
Data correspond to usage on the plateform after 2015. The current usage metrics is available 48-96 hours after online publication and is updated daily on week days.
Initial download of the metrics may take a while.