Free Access
Fig. A.2.
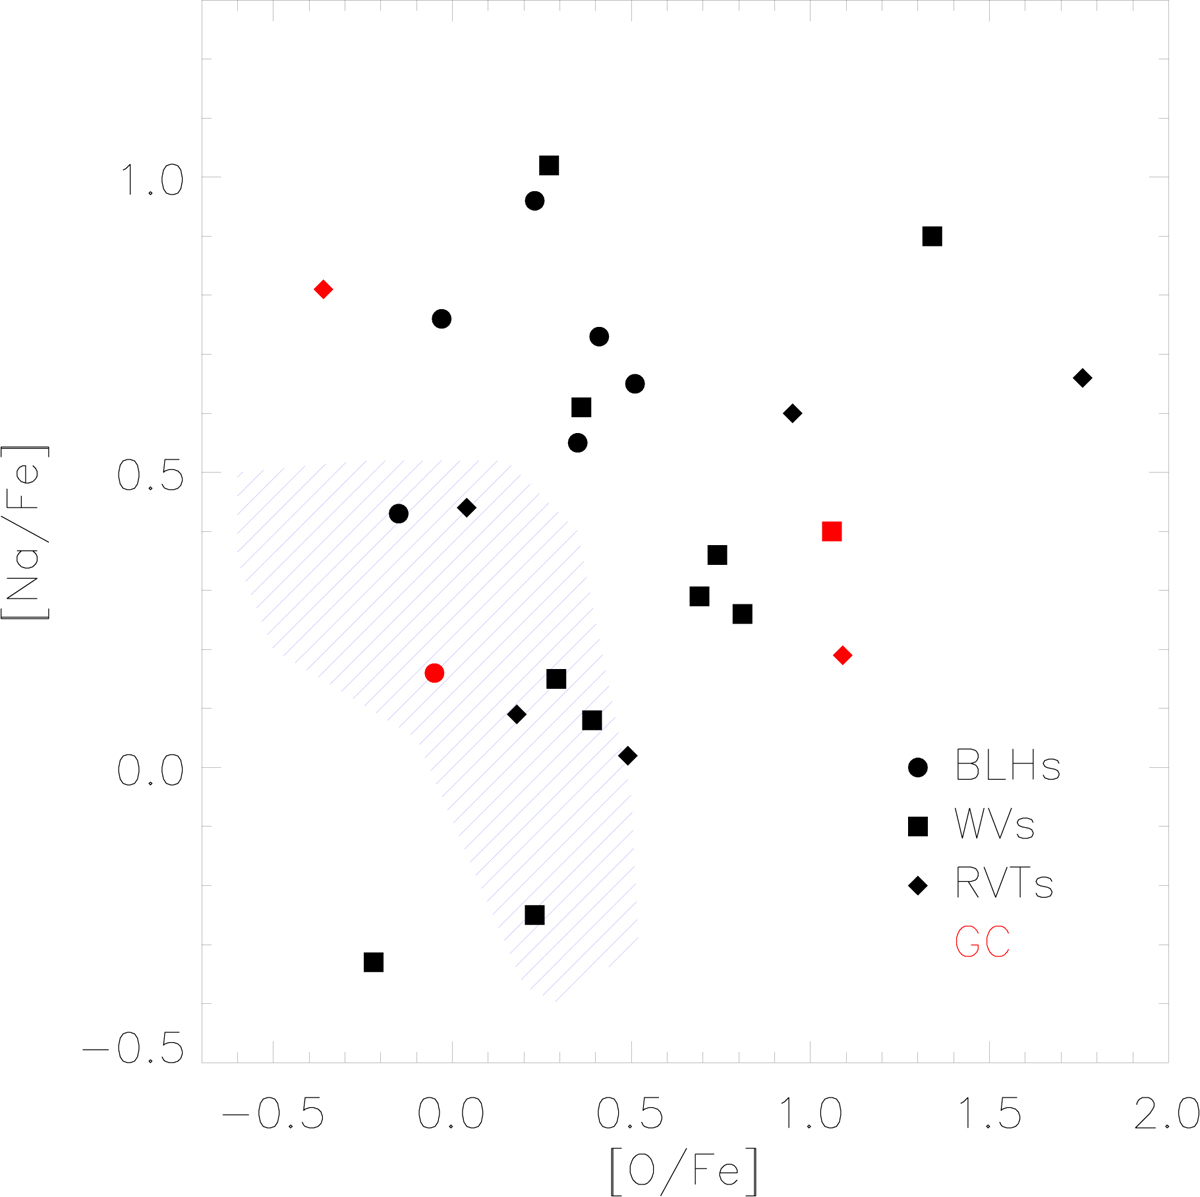
Na-O anti-correlation for field (black) and cluster (red) TIICs. The three different sub-groups are indicated by different symbols (see labels). The blue hatched area shows the area covered by cluster stars showing a well-defined anti-correlation between Na and O (Gratton et al. 2004b).
Current usage metrics show cumulative count of Article Views (full-text article views including HTML views, PDF and ePub downloads, according to the available data) and Abstracts Views on Vision4Press platform.
Data correspond to usage on the plateform after 2015. The current usage metrics is available 48-96 hours after online publication and is updated daily on week days.
Initial download of the metrics may take a while.