Fig. A.1.
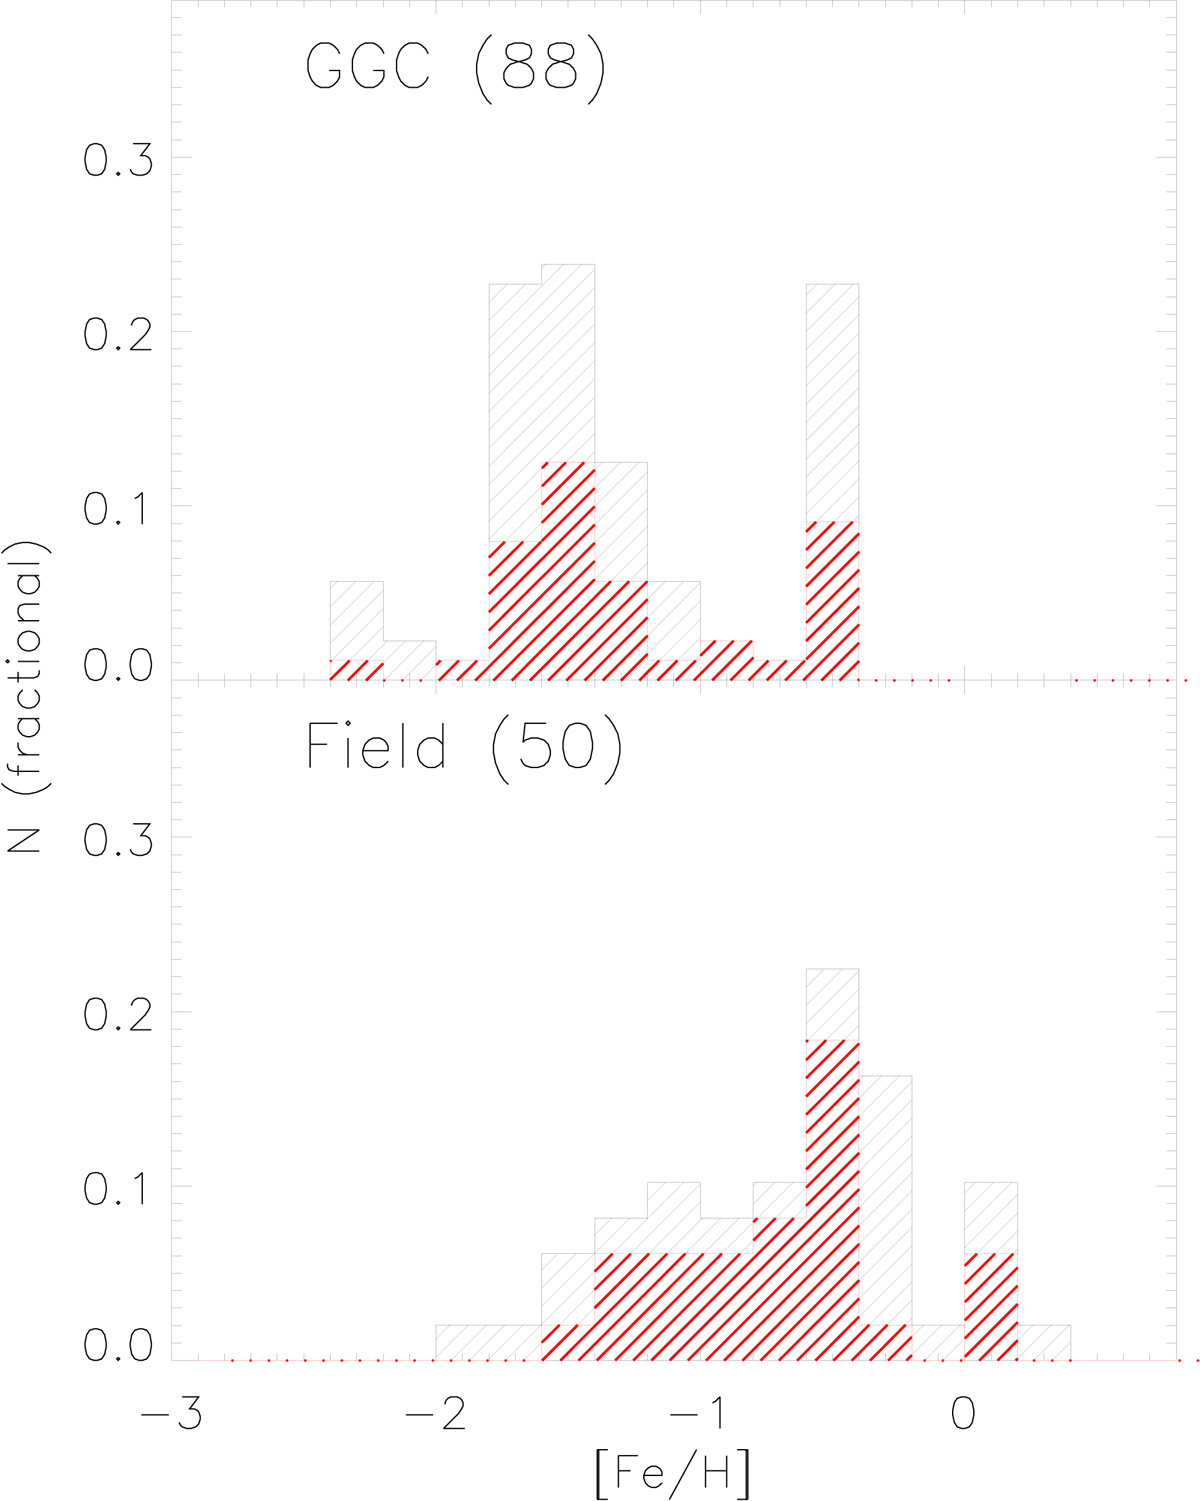
Top: metallicity distribution of cluster TIICs. The source catalogue is on the database by Clement et al. (2001). The iron abundances are based on the metallicity scale by Carretta et al. (2009). Bottom: same as the top panel, but for Galactic field TIICs. The iron abundances are based on high- and low-resolution spectra The red histogram displays the metallicity distribution of WVs only (see text for details).
Current usage metrics show cumulative count of Article Views (full-text article views including HTML views, PDF and ePub downloads, according to the available data) and Abstracts Views on Vision4Press platform.
Data correspond to usage on the plateform after 2015. The current usage metrics is available 48-96 hours after online publication and is updated daily on week days.
Initial download of the metrics may take a while.