Fig. 1.
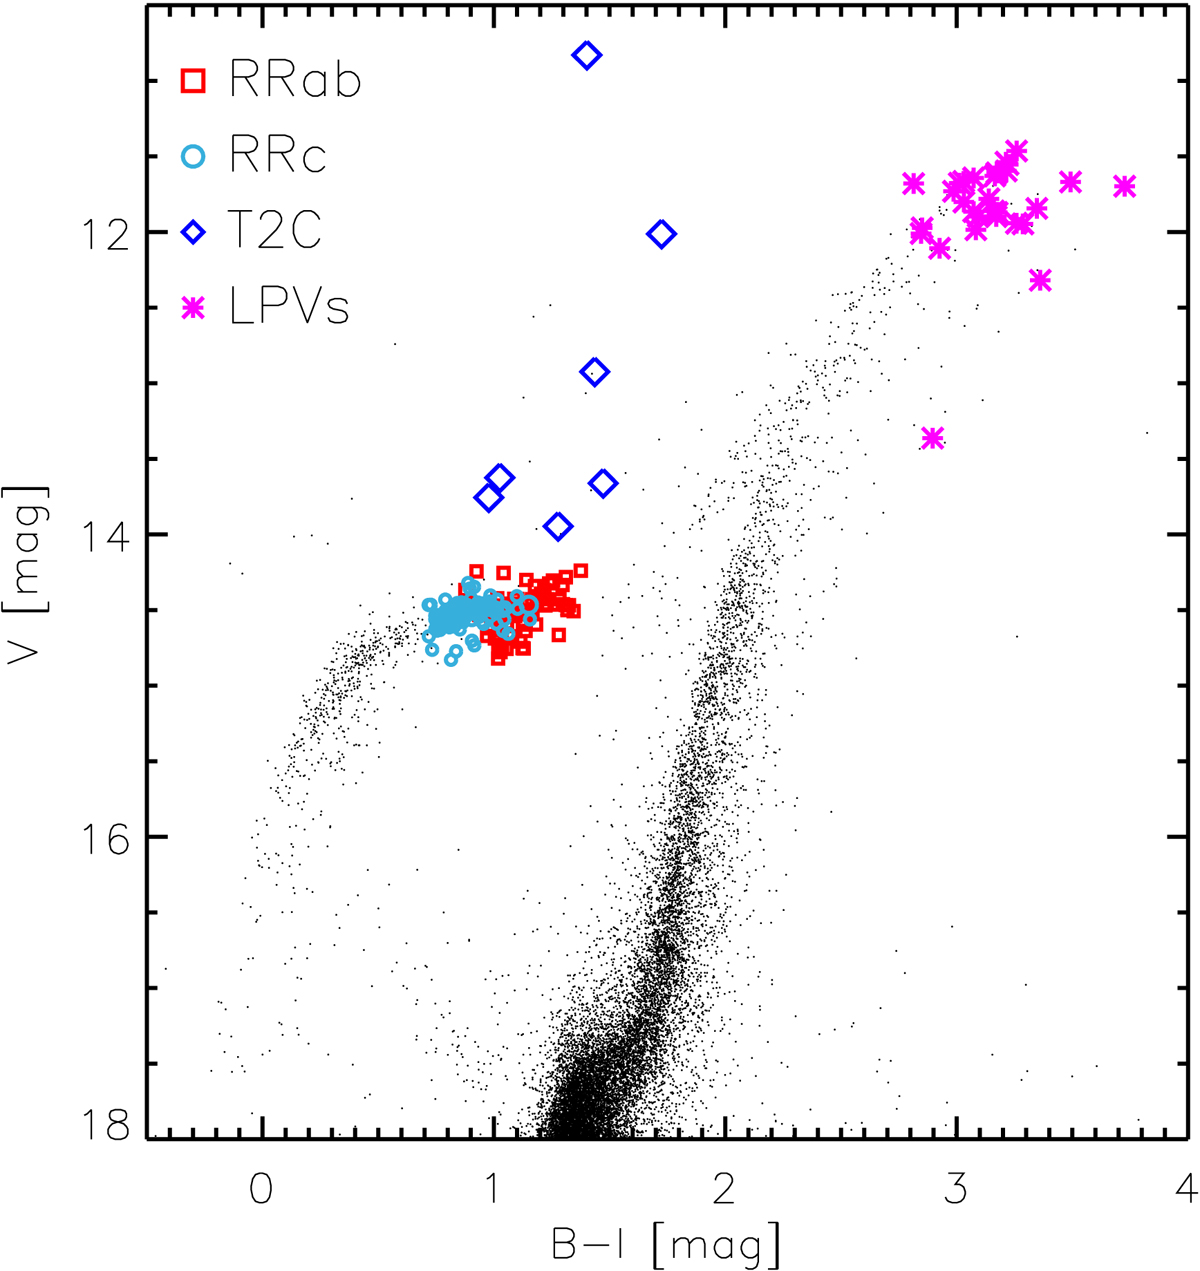
B − I,V Optical Colour-Magnitude Diagram of the Galactic globular ω Centauri (Braga et al. 2016). Black dots indicate cluster stars, selected according to radial distance and photometric error. The cyan circles and red squares indicate candidate cluster first overtone (101 RRc, −0.6 ≤ log P ≤ −0.3) and fundamental (85 RRab, −0.33 ≤ log P ≤ 0.0) RRLs, respectively (Braga et al. 2016). The blue diamonds denote TIICs (7, 0.05 ≤ log P ≤ 1.5), based on mean magnitudes derived in Braga et al. (2020). The magenta asterisks show a selection of cluster LPVs (1.58 ≤ log P ≤ 2.72) identified by Lebzelter & Wood (2016), but based on our own photometry.
Current usage metrics show cumulative count of Article Views (full-text article views including HTML views, PDF and ePub downloads, according to the available data) and Abstracts Views on Vision4Press platform.
Data correspond to usage on the plateform after 2015. The current usage metrics is available 48-96 hours after online publication and is updated daily on week days.
Initial download of the metrics may take a while.