Fig. 7
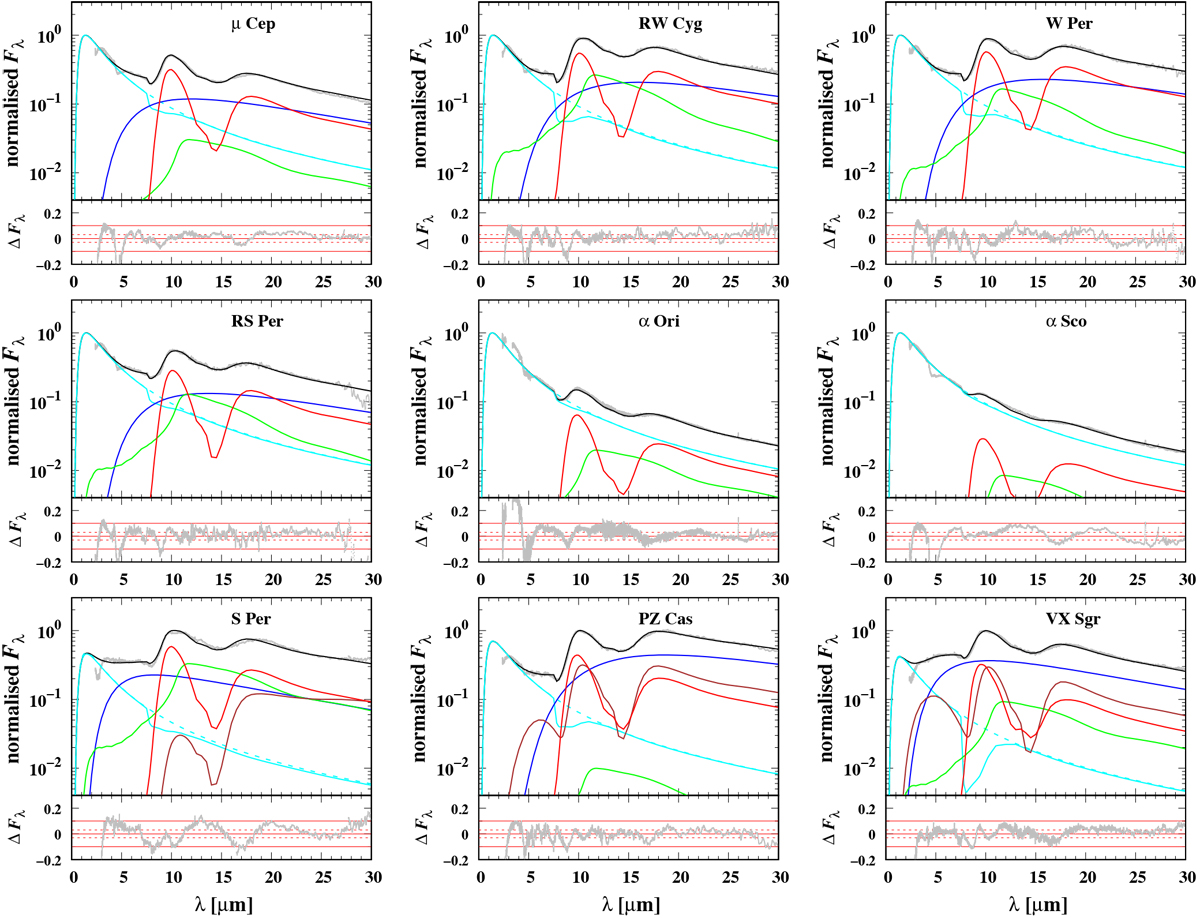
Fit of ISO spectra of comparison stars (grey dots) with optimised synthetic spectra (solid black line). Individual contributions of the different dust components are: silicate material (solid red line), corundum (solid green line), iron (solid blue line), silicate with iron inclusions (solid dark-red line). The cyan line shows the stellar black body spectrum. The lower part of each picture shows the relative flux difference between observed spectrum and model.
Current usage metrics show cumulative count of Article Views (full-text article views including HTML views, PDF and ePub downloads, according to the available data) and Abstracts Views on Vision4Press platform.
Data correspond to usage on the plateform after 2015. The current usage metrics is available 48-96 hours after online publication and is updated daily on week days.
Initial download of the metrics may take a while.