Fig. 6
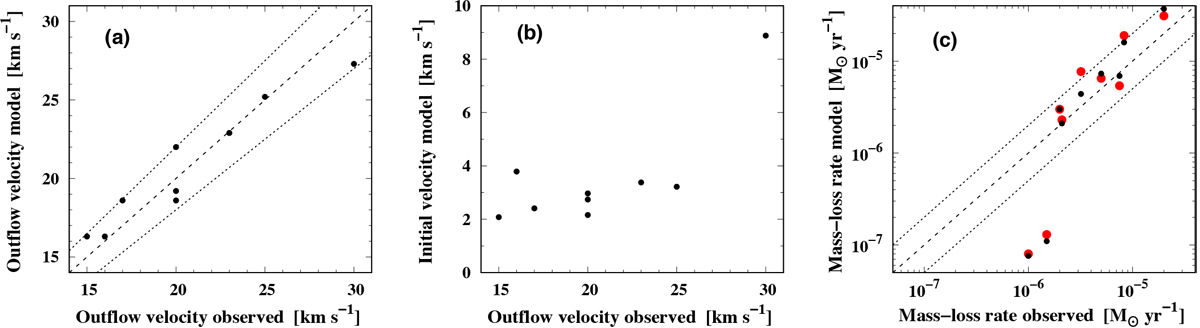
Comparison of observed values with model results for the final outflow velocity, the initial velocity, and the mass-loss rate. (a) Terminal velocity for models with initial velocities v0 = 2 km s−1. The dotted lines show the limit of a deviation of the model result from the observed velocity by 10%. (b) Initial velocity for models with given terminal velocities. (c) Mass-loss rates for models with initial velocities v0 = 2 km s−1 (black circles) and with given terminal velocities (red circles). The dotted lines show the limit of a deviation of the model result from the observed mass-loss rate by a factor of two.
Current usage metrics show cumulative count of Article Views (full-text article views including HTML views, PDF and ePub downloads, according to the available data) and Abstracts Views on Vision4Press platform.
Data correspond to usage on the plateform after 2015. The current usage metrics is available 48-96 hours after online publication and is updated daily on week days.
Initial download of the metrics may take a while.