Free Access
Fig. 5
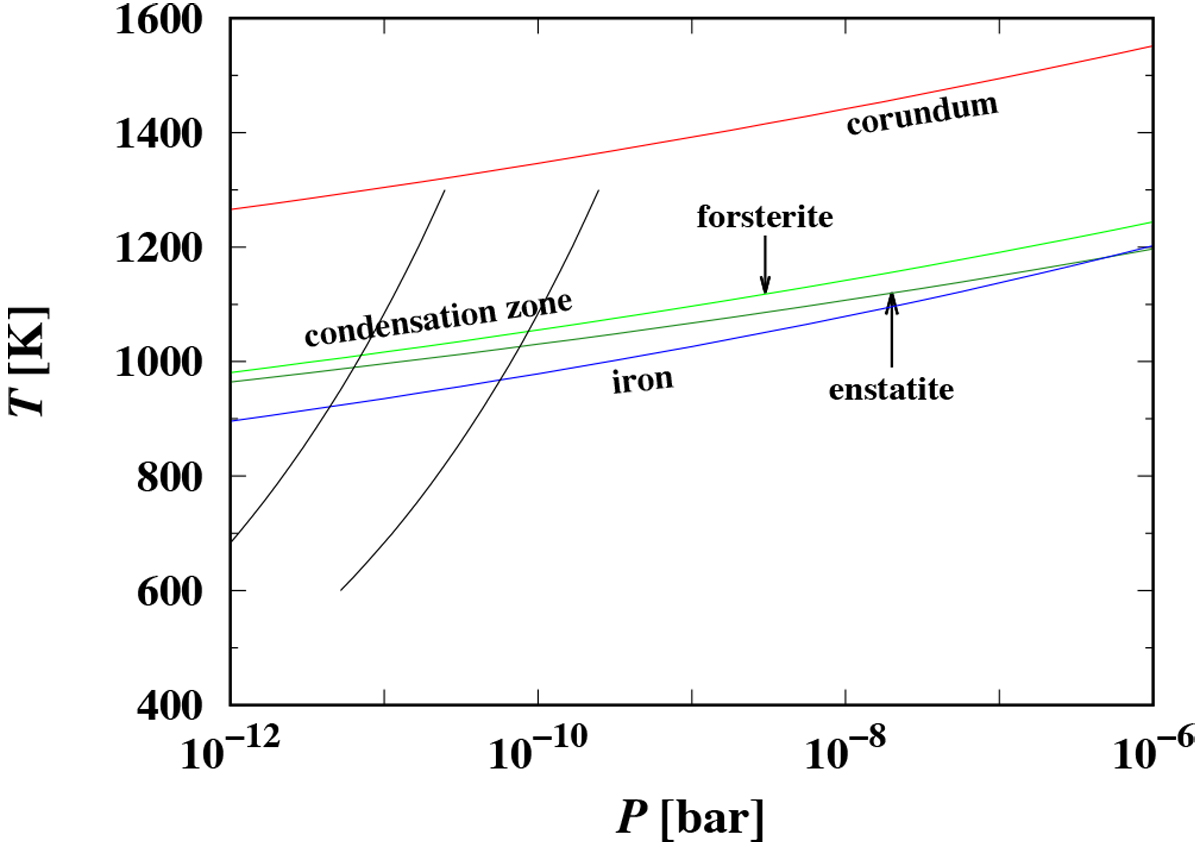
Upper limit for thermal stability of the dust components in case of thermal equilibrium. The two black lines show the possible p-T values at the inner edge of a dust shell for an assumed wind velocity of 2 km−1 and mass-loss rates of 10−5 (right) and 10−6 M⊙ a−1 (left) for a stationary outflow.
Current usage metrics show cumulative count of Article Views (full-text article views including HTML views, PDF and ePub downloads, according to the available data) and Abstracts Views on Vision4Press platform.
Data correspond to usage on the plateform after 2015. The current usage metrics is available 48-96 hours after online publication and is updated daily on week days.
Initial download of the metrics may take a while.