Fig. 3
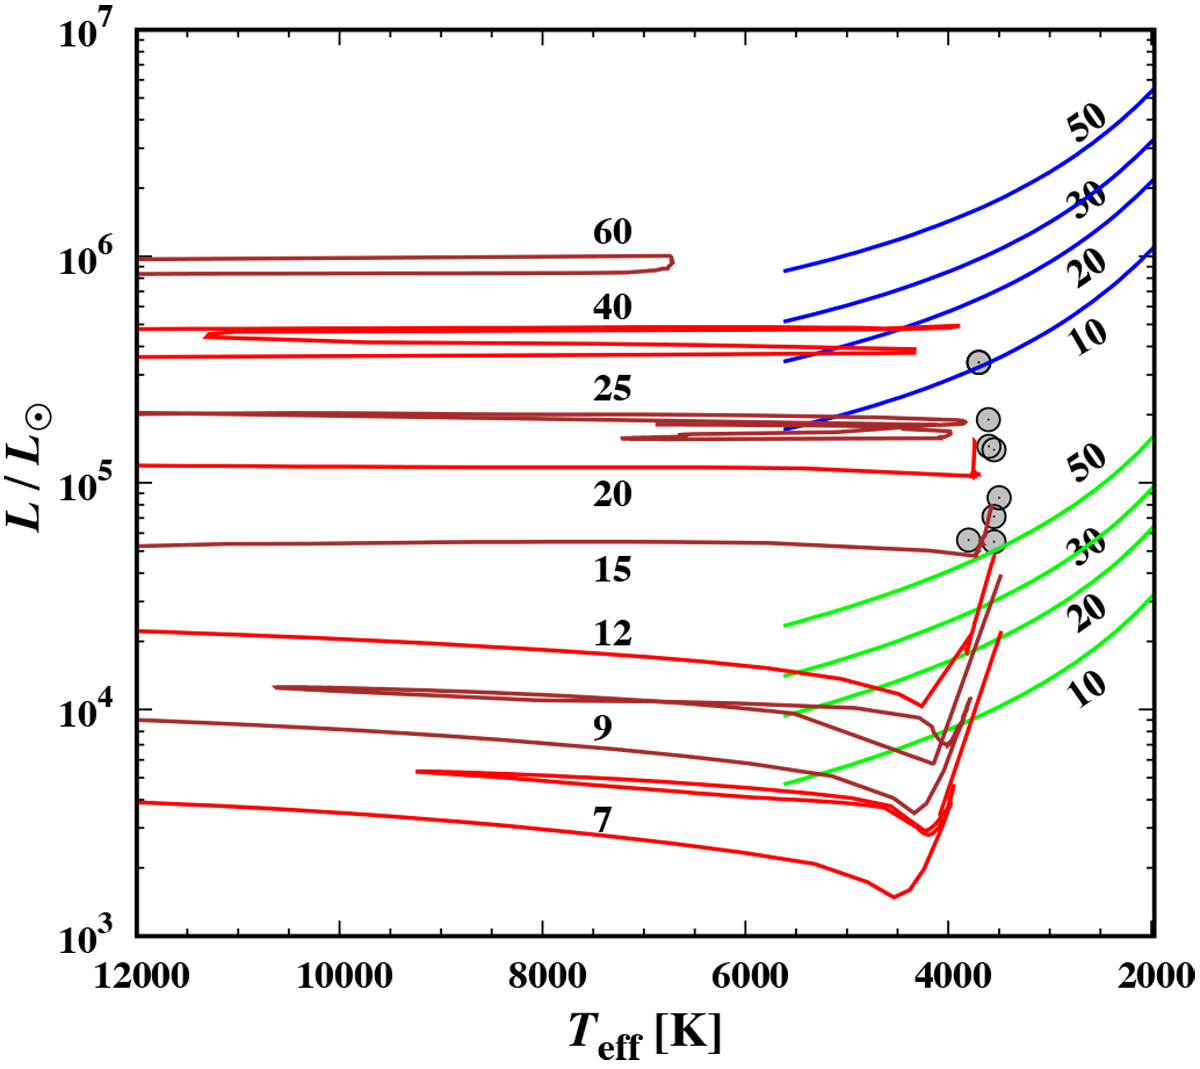
Hertzsprung-Russell diagram with evolutionary paths for non-rotating massive stars that enter at the end of their live the RGB (from Ekström et al. 2012). The grey dots correspond to the set of supergiants from Table 1. The lower set of lines (green) in the right part of the figure shows the Eddington luminosity, Eq. (15), calculated for silicate dust and for stellar masses of 10, 20, 30, and 50 M⊙. The corresponding upper set of lines (blue) is for alumina dust. These limits are derived with the assumption that all Si or Al is condensed into their respective dust components. For a lower fraction f of condensation the lines have to be scaled upwards ∝1∕f.
Current usage metrics show cumulative count of Article Views (full-text article views including HTML views, PDF and ePub downloads, according to the available data) and Abstracts Views on Vision4Press platform.
Data correspond to usage on the plateform after 2015. The current usage metrics is available 48-96 hours after online publication and is updated daily on week days.
Initial download of the metrics may take a while.