Free Access
Fig. 6.
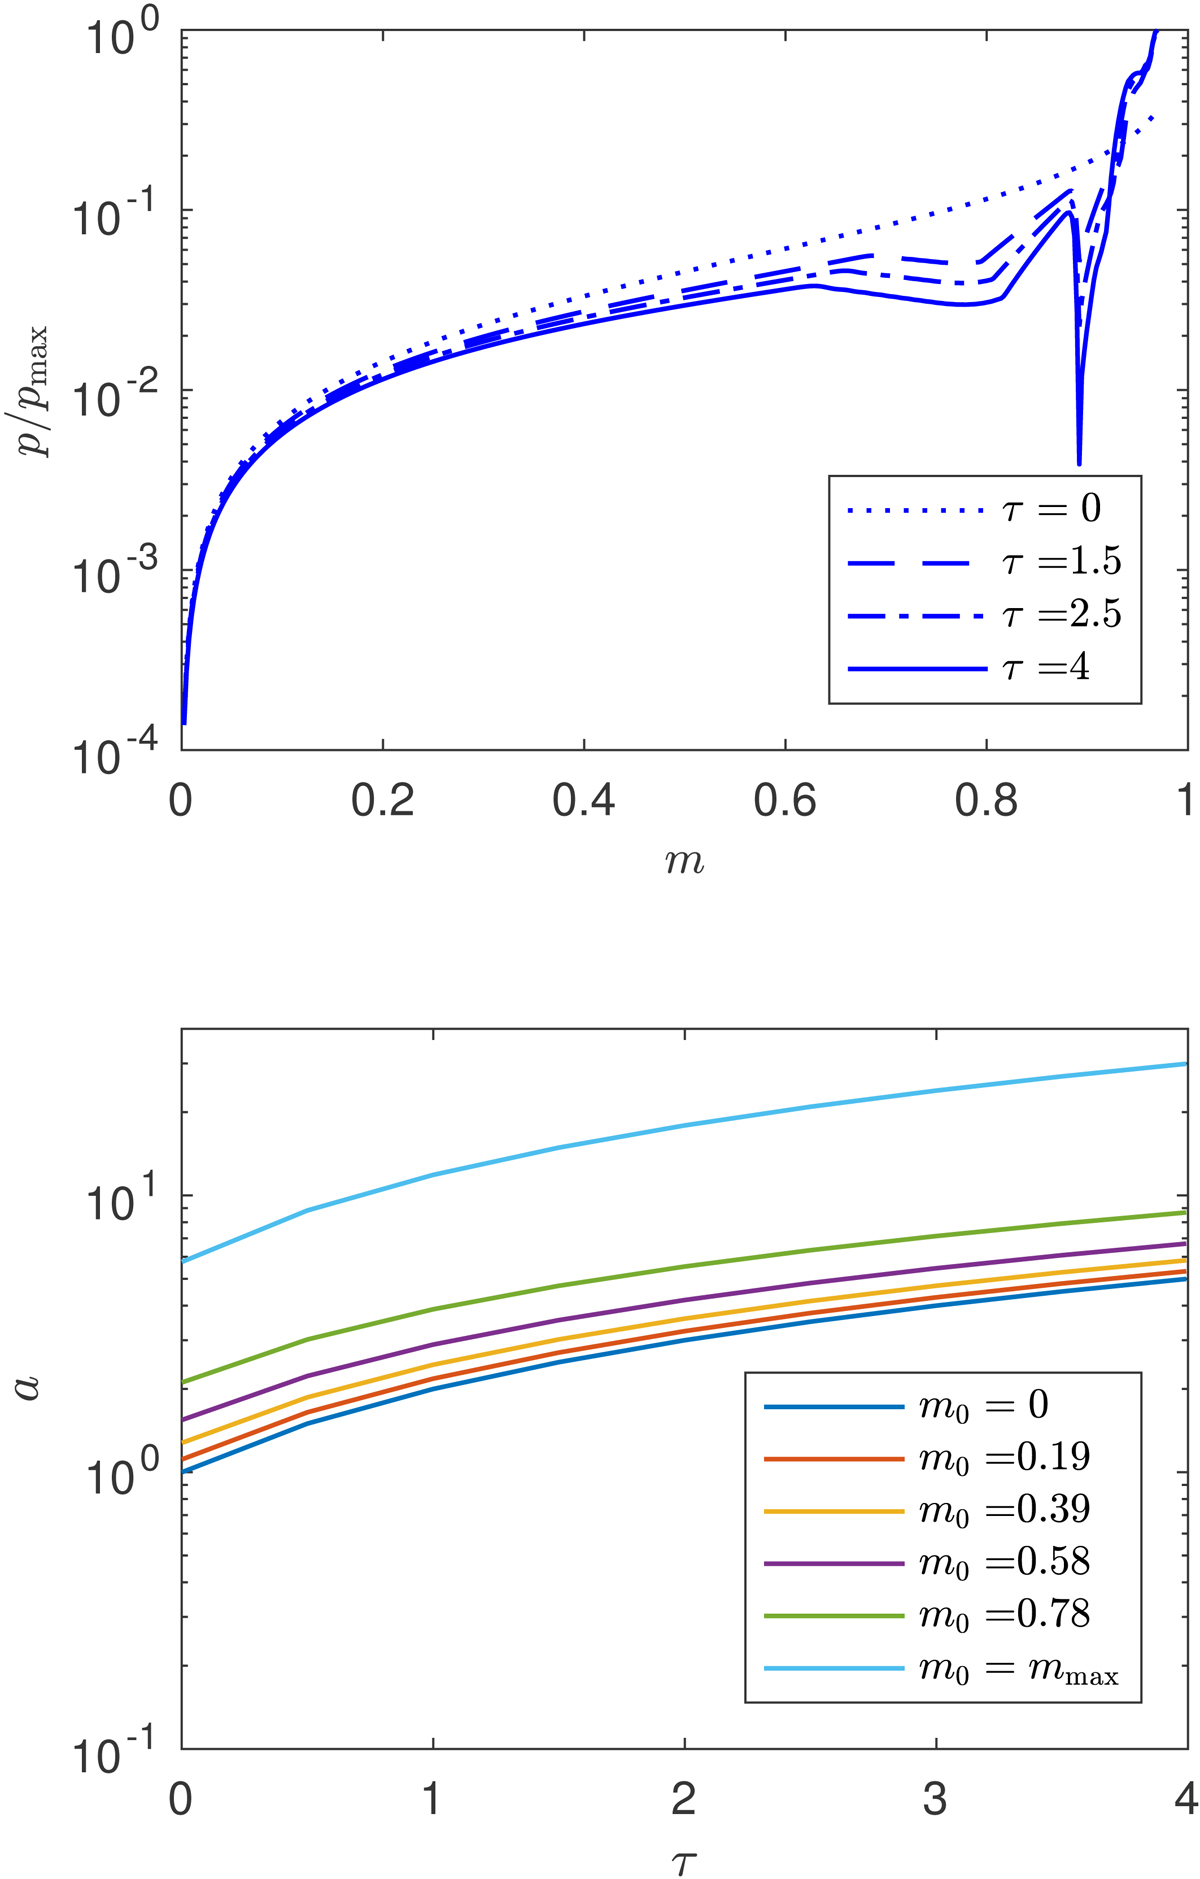
Top plot: fractional change in the linear polarization as a function of the particle eccentricity distribution function, f, (see top plot Fig. 4) and time τ. Bottom plot: evolution of the semi-major axis a (in dimensionless units) with time τ for a range of initial eccentricities, m0.
Current usage metrics show cumulative count of Article Views (full-text article views including HTML views, PDF and ePub downloads, according to the available data) and Abstracts Views on Vision4Press platform.
Data correspond to usage on the plateform after 2015. The current usage metrics is available 48-96 hours after online publication and is updated daily on week days.
Initial download of the metrics may take a while.