Free Access
Fig. 4.
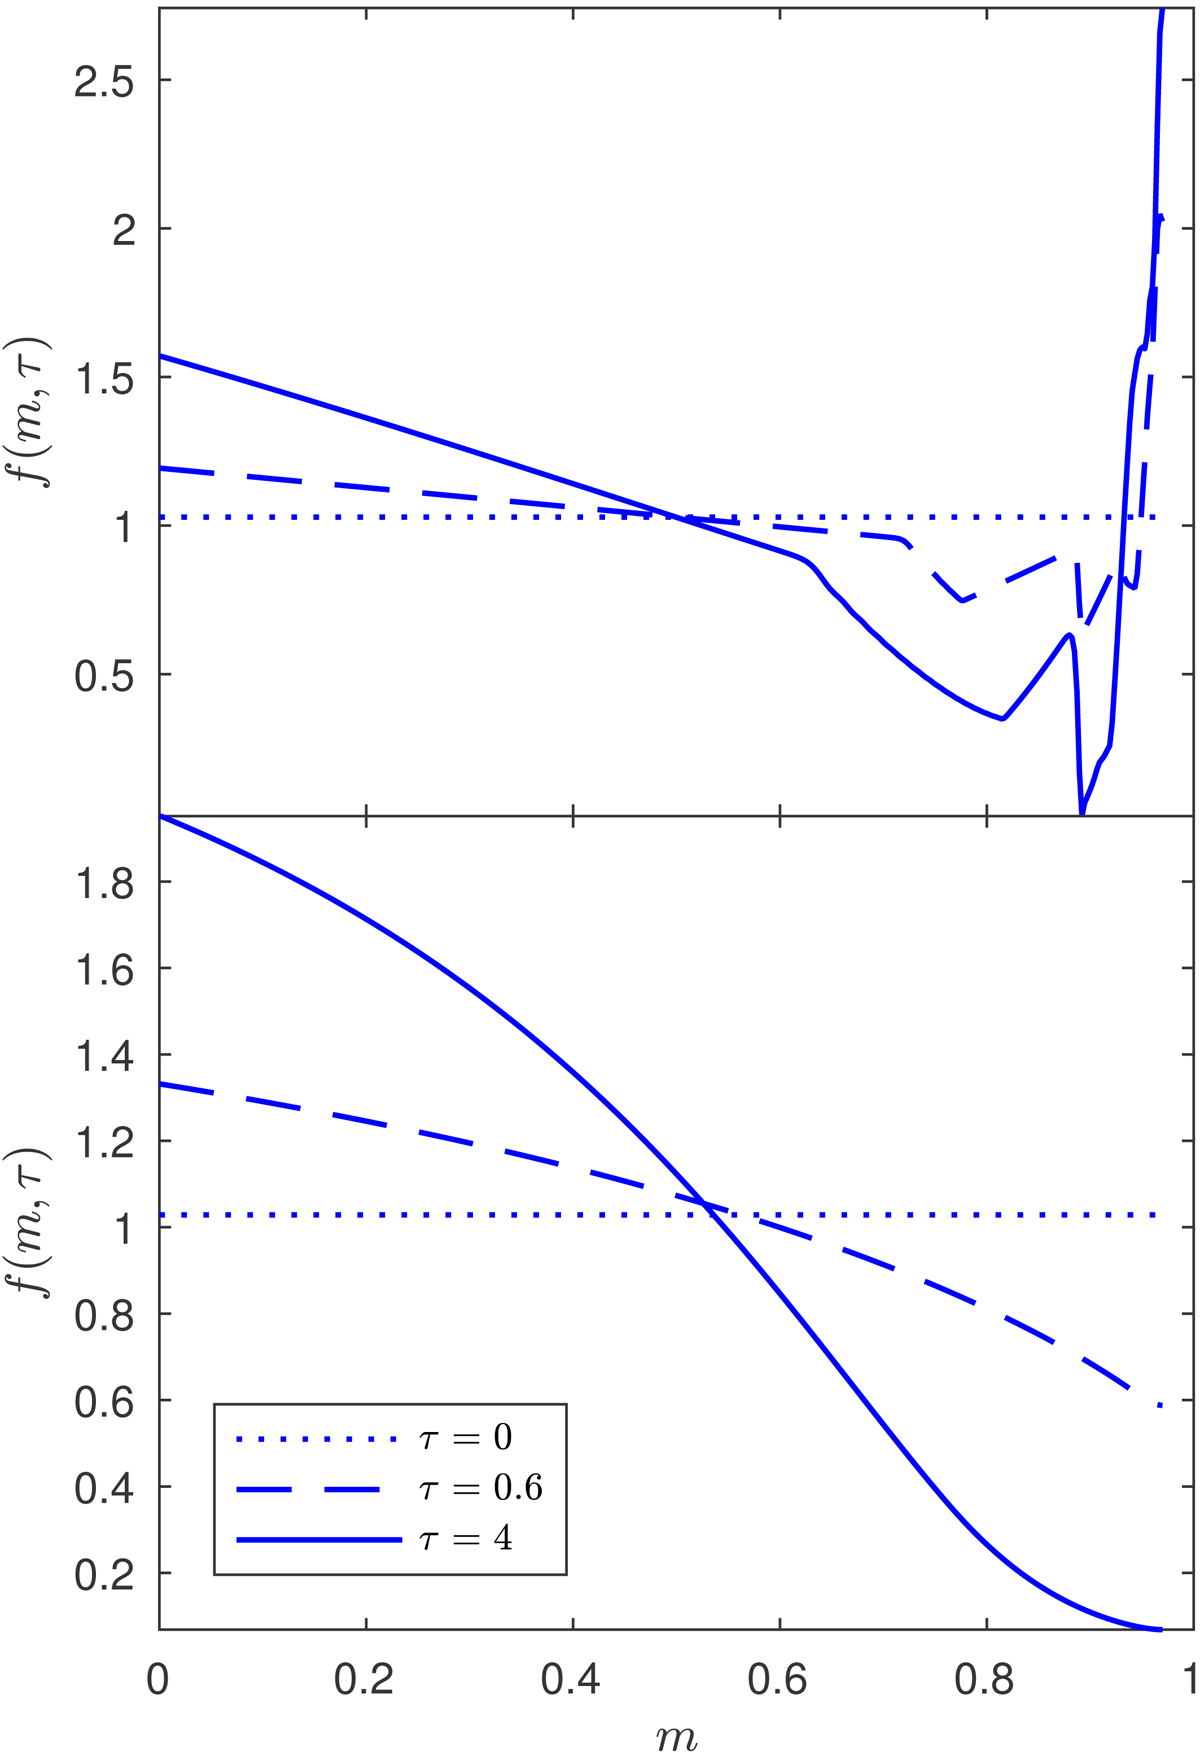
Eccentricity distribution function as a function of time for R (top plot) and Rπ/4 (bottom plot). An initial uniform distribution function (dotted line) is assumed and plotted for an intermediate time (dashed line) and at the end of the simulation (solid line).
Current usage metrics show cumulative count of Article Views (full-text article views including HTML views, PDF and ePub downloads, according to the available data) and Abstracts Views on Vision4Press platform.
Data correspond to usage on the plateform after 2015. The current usage metrics is available 48-96 hours after online publication and is updated daily on week days.
Initial download of the metrics may take a while.