Fig. 7.
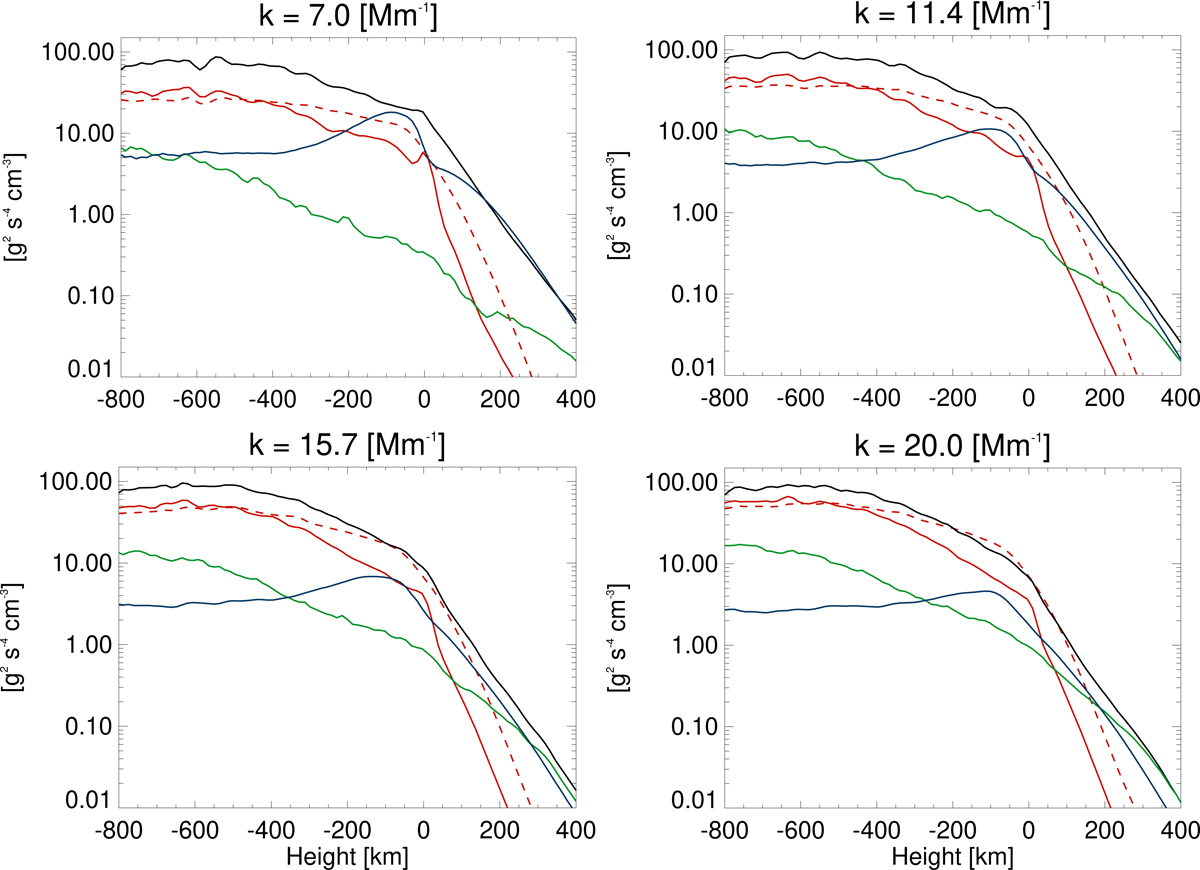
Similar to Fig. 6, but now for the vertical component of momentum. The panels show the vertical (horizontal) transport of vertical momentum, represented by the solid (dashed) red curves. The black curve indicates the contribution of the vertical pressure gradient, the blue curve the contribution of gravity, and the green curve the contribution of the Lorentz force. The panels from top left to bottom right are sorted from smaller to larger wavenumber. Top left: results at wavenumber k = 7 Mm−1 (wavelength 900 km). Top right: wavenumber k = 11.4 Mm−1 (wavelength 550 km). Bottom left: wavenumber k = 15.7 Mm−1 (wavelength 400 km). Bottom right: wavenumber k = 20 Mm−1 (wavelength 312 km).
Current usage metrics show cumulative count of Article Views (full-text article views including HTML views, PDF and ePub downloads, according to the available data) and Abstracts Views on Vision4Press platform.
Data correspond to usage on the plateform after 2015. The current usage metrics is available 48-96 hours after online publication and is updated daily on week days.
Initial download of the metrics may take a while.