Fig. 4.
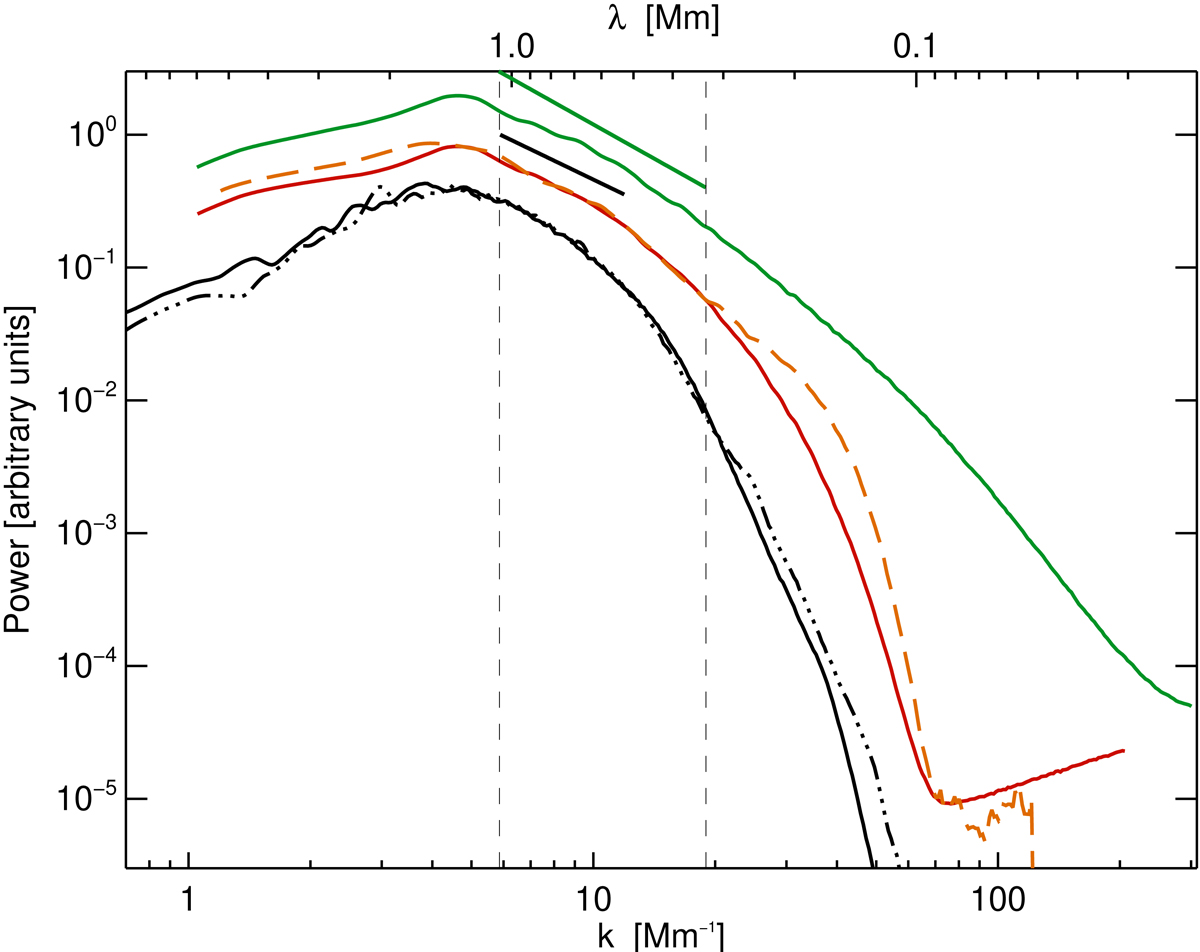
Power spectra of the intensity maps. Spectra for the two quiet-Sun IMaX time series are plotted as solid and dash-triple-dotted black lines. The dashed orange curve corresponds to the power spectrum derived from data acquired by the SuFI instrument. The solid red curve is obtained from the simulations through an ODF spectral synthesis of the full SuFI filter at the 300 nm band and applying the smearing procedure presented in Sect. 4. The green curve corresponds to the same data as the red curve without smearing. The straight green line indicates a k−1.71 ± 0.245 power-law fit of the green curve. The straight black line corresponds to a k−1.47 ± 0.193 power-law fit of the underlying portion of the dashed orange curve. The two vertical dashed lines indicate the location of the integral and Taylor scales. Spectra from observations and simulations have been scaled because the observations are not calibrated to an absolute value.
Current usage metrics show cumulative count of Article Views (full-text article views including HTML views, PDF and ePub downloads, according to the available data) and Abstracts Views on Vision4Press platform.
Data correspond to usage on the plateform after 2015. The current usage metrics is available 48-96 hours after online publication and is updated daily on week days.
Initial download of the metrics may take a while.