Fig. 3.
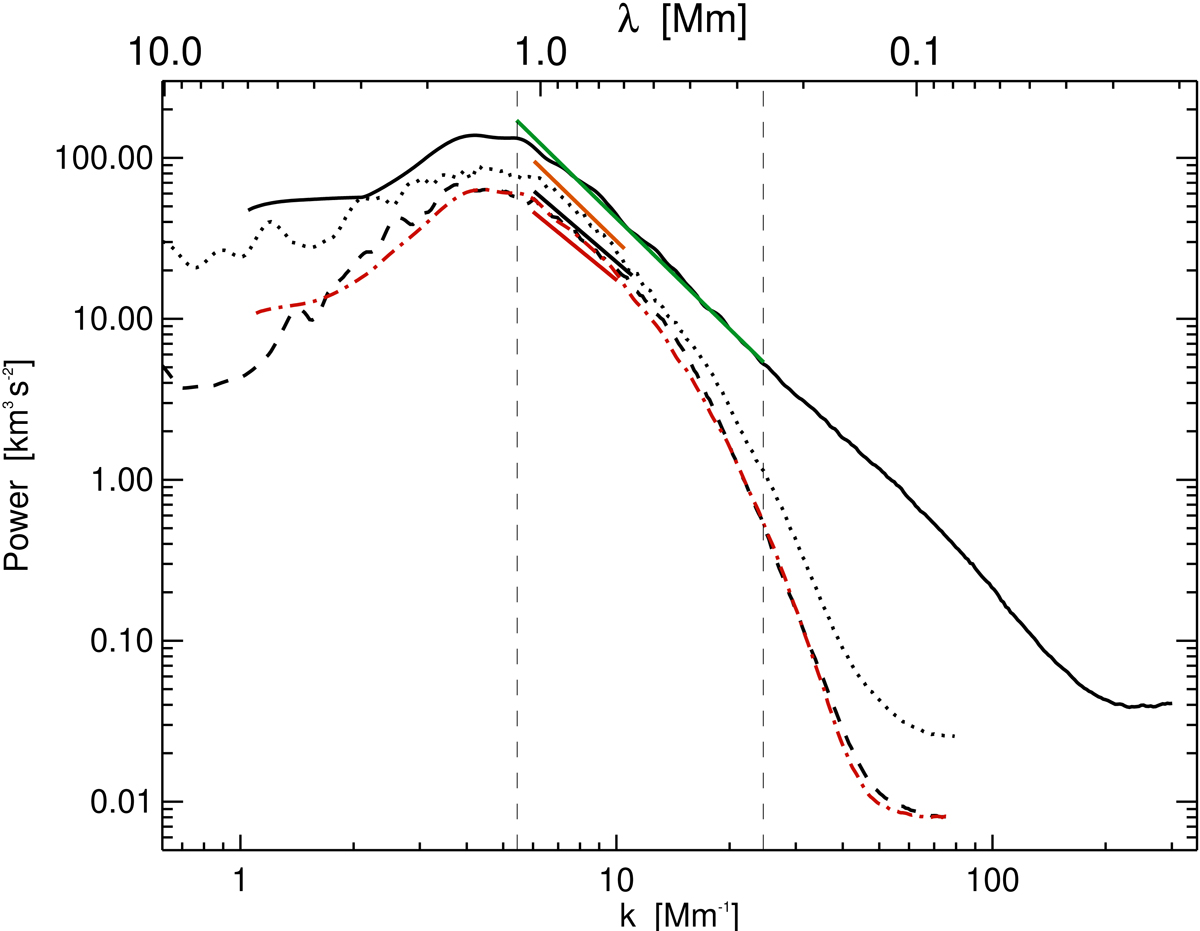
Spatial power spectra of the Doppler velocity. We use the spatial wavenumber (k = 2π/λ, lower horizontal axis) and the corresponding wavelength λ (upper horizontal axis) as abscissa. The dashed black curve corresponds to the power spectrum of the quiet-Sun IMaX time series, and the active-Sun spectrum (second IMaX flight) is represented by the dotted black line. The power spectrum of the Doppler velocity obtained from simulations (from spectral synthesis of the IMaX spectral line) without degradation is represented as a solid black line. The dash-dotted red curve corresponds to the power spectrum of the Doppler velocity from simulations (as the black curve), but this time, we applied spatial and spectral degradation to approach the IMaX observational conditions (as described in Sect. 4). The straight green line represents a k−2.25 ± 0.072 power law determined as a fit to the underling black curve. The ± part represents the uncertainty of the least-squares fit. The straight orange line is a k−2.24 ± 0.27 power-law fit of the corresponding part of the dotted black curve. The straight black line corresponds to a fit of the corresponding portion of the dashed black curve and corresponds to k−2.0 ± 0.22. Finally, the straight red line is a k−1.96 ± 0.25 fit of the dashed red line. The two vertical dashed lines indicate the location of the integral and Taylor scales.
Current usage metrics show cumulative count of Article Views (full-text article views including HTML views, PDF and ePub downloads, according to the available data) and Abstracts Views on Vision4Press platform.
Data correspond to usage on the plateform after 2015. The current usage metrics is available 48-96 hours after online publication and is updated daily on week days.
Initial download of the metrics may take a while.