Fig. 1.
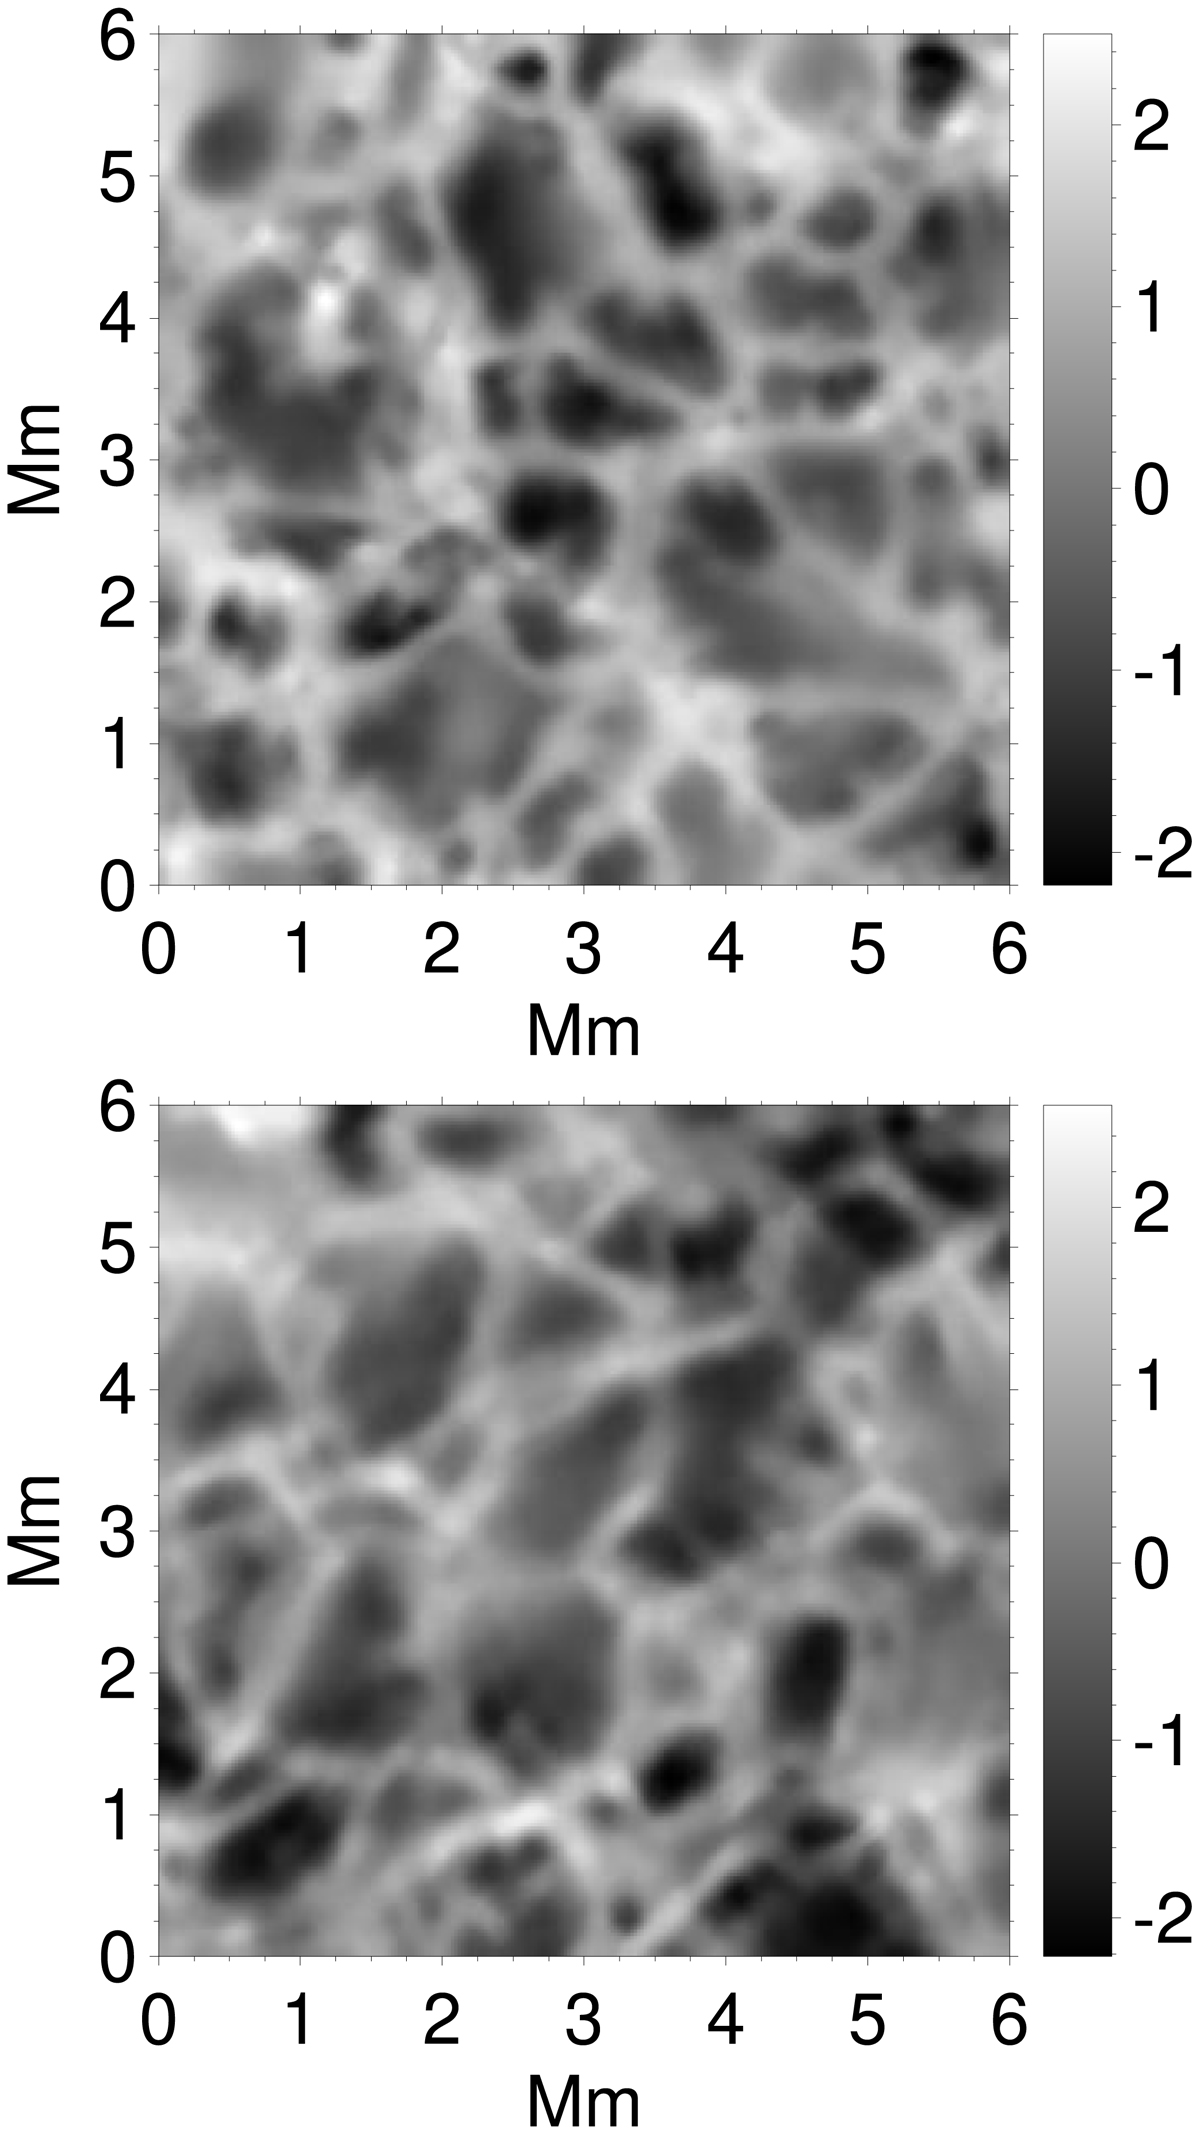
Top: Doppler velocity observed by the SUNRISE/IMaX instrument using the spectral line Fe I 5250.2 Å. The size of the displayed domain is chosen to be 6 × 6 Mm2 for comparison with the simulation domain. Bottom: Doppler velocity from simulations using the same spectral line as for the observations. The displayed Doppler map has been degraded to approach observational conditions. The velocity is expressed in km s−1. Positive velocities correspond to downward-directed flows.
Current usage metrics show cumulative count of Article Views (full-text article views including HTML views, PDF and ePub downloads, according to the available data) and Abstracts Views on Vision4Press platform.
Data correspond to usage on the plateform after 2015. The current usage metrics is available 48-96 hours after online publication and is updated daily on week days.
Initial download of the metrics may take a while.