Fig. 8.
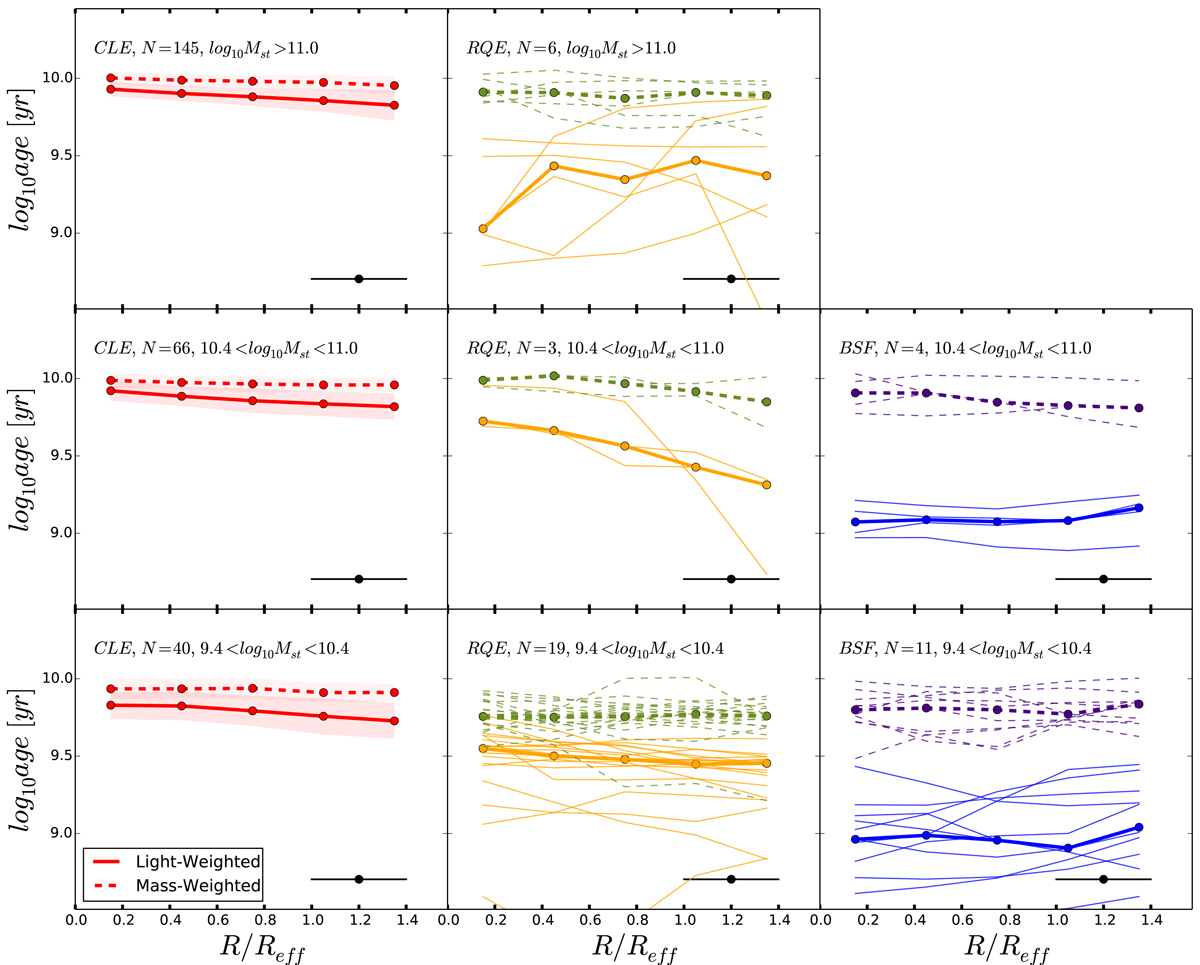
Median mass-weighted and luminosity-weighted stellar ages profiles (dots connected with thick dashed and thick solid lines, respectively). The left column is for CLEs, the central column is for RQEs, and the right column is for BSFs. Each row is a stellar-mass bin, which increases from the bottom to the top. The shaded regions in the left panels correspond to the 16th and 84th percentiles (darker for the luminosity-weighted quantities). Given the relatively low numbers of RQE and BSF galaxies, we show the individual profiles as thin lines. The number of galaxies of each type in a given mass bin is shown in each panel. The horizontal error bar is the typical PSF size that represents the minimum radial resolution of the IFU.
Current usage metrics show cumulative count of Article Views (full-text article views including HTML views, PDF and ePub downloads, according to the available data) and Abstracts Views on Vision4Press platform.
Data correspond to usage on the plateform after 2015. The current usage metrics is available 48-96 hours after online publication and is updated daily on week days.
Initial download of the metrics may take a while.