Fig. 6.
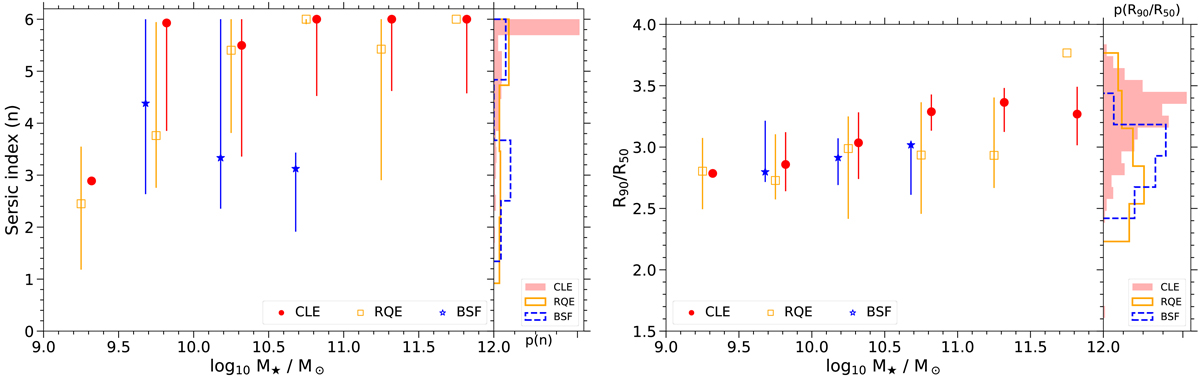
Two left panels: median Sérsic index as a function of stellar mass and normalized density distributions of the Sérsic index (n), respectively. Two right panels: median concentration (R90/R50) as a function of stellar mass and normalized density distributions of the concentration. The symbols of the medians are red filled circles for CLEs, orange open squares for RQEs, and blue stars for BSFs. The error bars correspond to the 16th and 84th percentiles. The distributions for CLE, RQE, and BSF galaxies are shown in red solid, orange open, and blue dashed histograms, respectively. The integral of each histogram sums to unity.
Current usage metrics show cumulative count of Article Views (full-text article views including HTML views, PDF and ePub downloads, according to the available data) and Abstracts Views on Vision4Press platform.
Data correspond to usage on the plateform after 2015. The current usage metrics is available 48-96 hours after online publication and is updated daily on week days.
Initial download of the metrics may take a while.