Fig. 3.
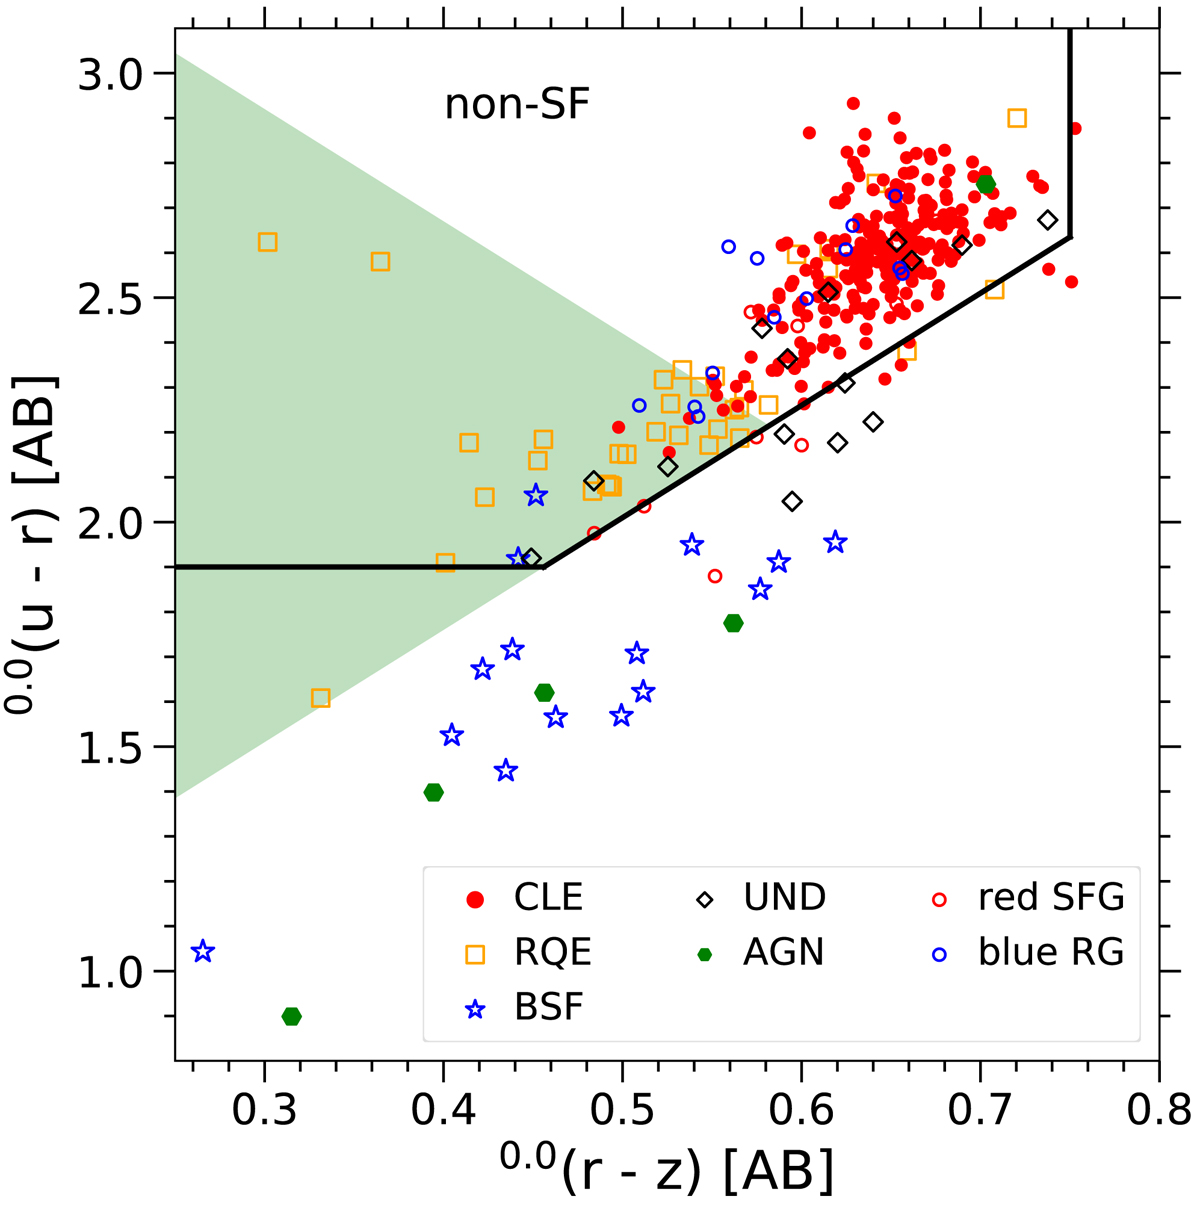
Color–color diagram. The colors are in AB magnitudes and K-corrected at z = 0. The symbols for the galaxies are the same as in Fig. 1. The thick black lines enclose the non-star-forming region of McIntosh et al. (2014) based on Holden et al. (2012). The green shaded region corresponds to an empirical relation to select RQE galaxies defined by McIntosh et al. (2014).
Current usage metrics show cumulative count of Article Views (full-text article views including HTML views, PDF and ePub downloads, according to the available data) and Abstracts Views on Vision4Press platform.
Data correspond to usage on the plateform after 2015. The current usage metrics is available 48-96 hours after online publication and is updated daily on week days.
Initial download of the metrics may take a while.