Fig. 2.
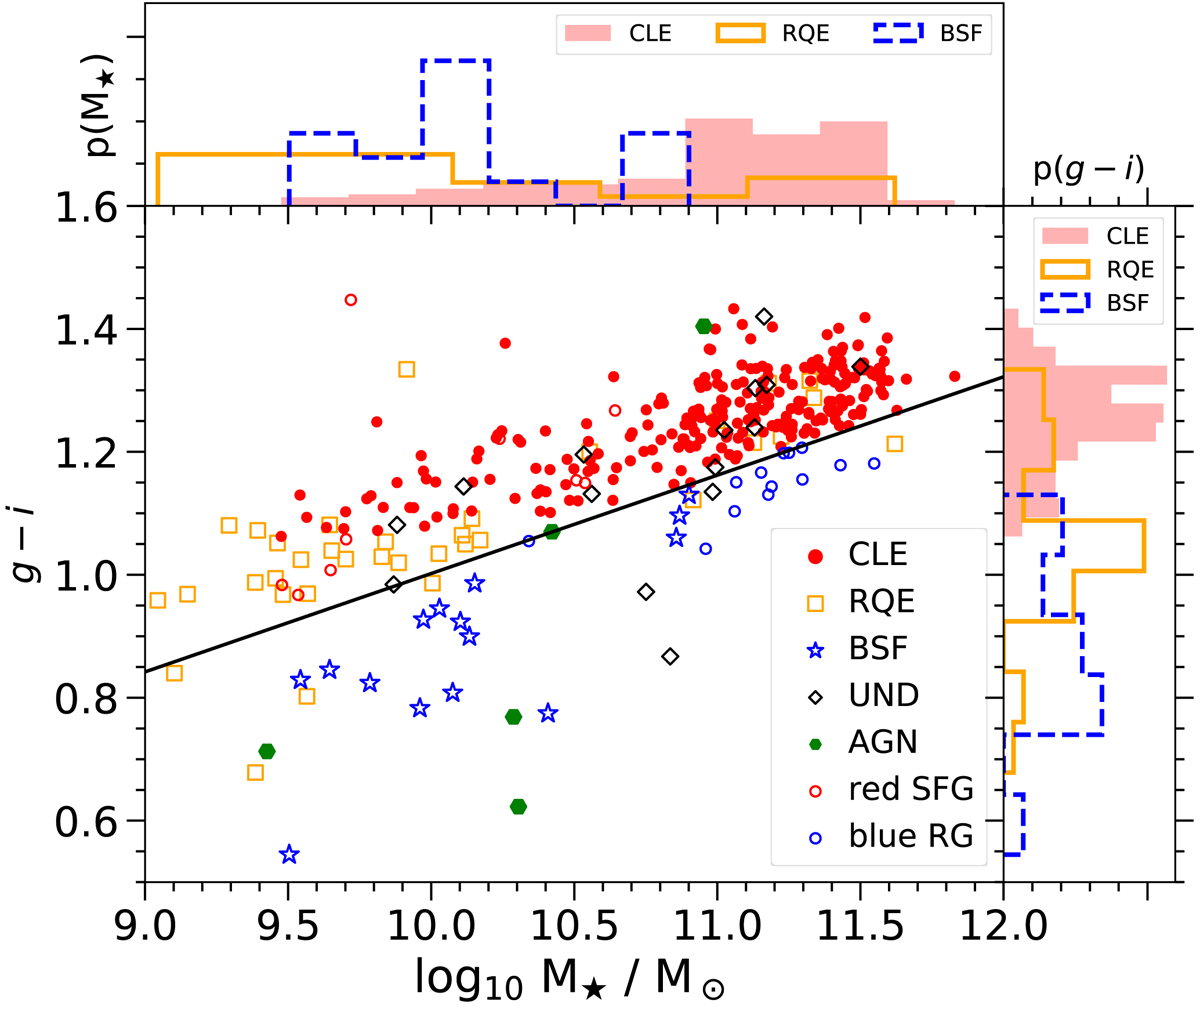
As a function of stellar mass, g − i color for E galaxies from MaNGA. The black solid line separates red and blue galaxies. The symbols for the galaxies are the same as in Fig. 1. Top and right panels: normalized density distributions of stellar mass and g − i color, respectively, for CLE galaxies (red solid histogram), RQE galaxies (orange open histogram), and BSF galaxies (blue dashed histogram). The integral of each histogram sums to unity.
Current usage metrics show cumulative count of Article Views (full-text article views including HTML views, PDF and ePub downloads, according to the available data) and Abstracts Views on Vision4Press platform.
Data correspond to usage on the plateform after 2015. The current usage metrics is available 48-96 hours after online publication and is updated daily on week days.
Initial download of the metrics may take a while.