Fig. 18.
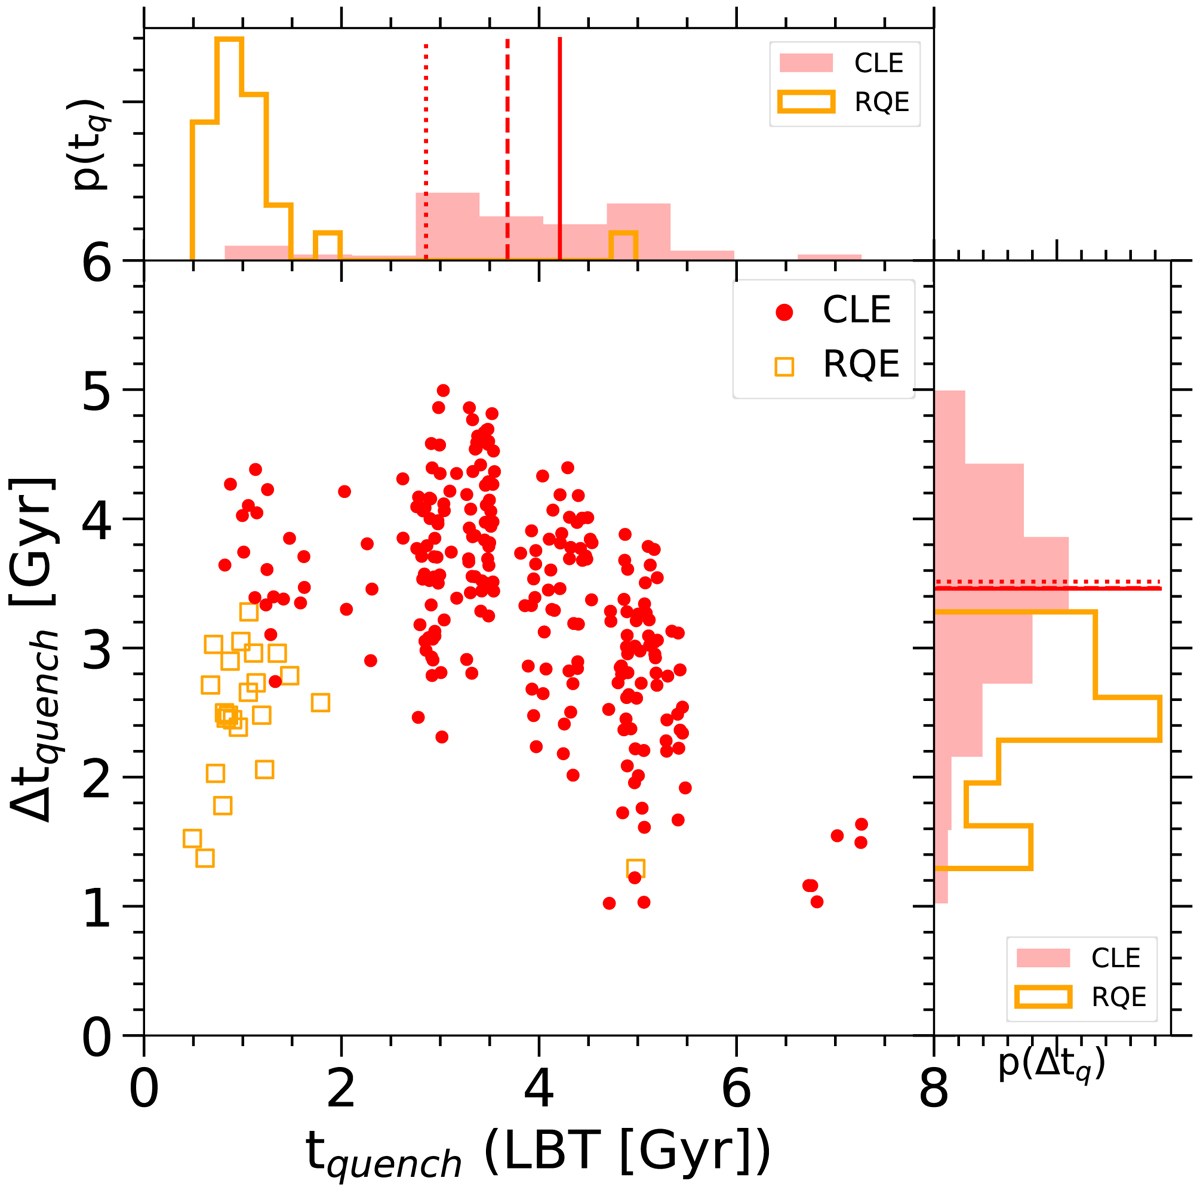
Long-term quenching look back time (tq, LB) and quenching time-scale (Δtq) calculated from the nonparametric stellar population age distributions (see Sect. 5.3 for details). Red circles are for CLEs and orange squares are for RQEs. The upper and right panels show the normalized distributions of tq, LB and Δtq, respectively, for CLE galaxies (red solid histogram) and RQE galaxies (orange open histogram). The integral of each histogram sums to unity. The vertical (horizontal) lines in the upper (right) panel correspond to median values of tq, LB (Δtq) for CLE galaxies in three stellar mass bins: 9.4 < log(M⋆/M⊙) < 10.4 (dotted), 10.4 ≤ log(M⋆/M⊙) < 11 (dashed), and 11 ≤ log(M⋆/M⊙) < 12 (solid).
Current usage metrics show cumulative count of Article Views (full-text article views including HTML views, PDF and ePub downloads, according to the available data) and Abstracts Views on Vision4Press platform.
Data correspond to usage on the plateform after 2015. The current usage metrics is available 48-96 hours after online publication and is updated daily on week days.
Initial download of the metrics may take a while.