Fig. 17.
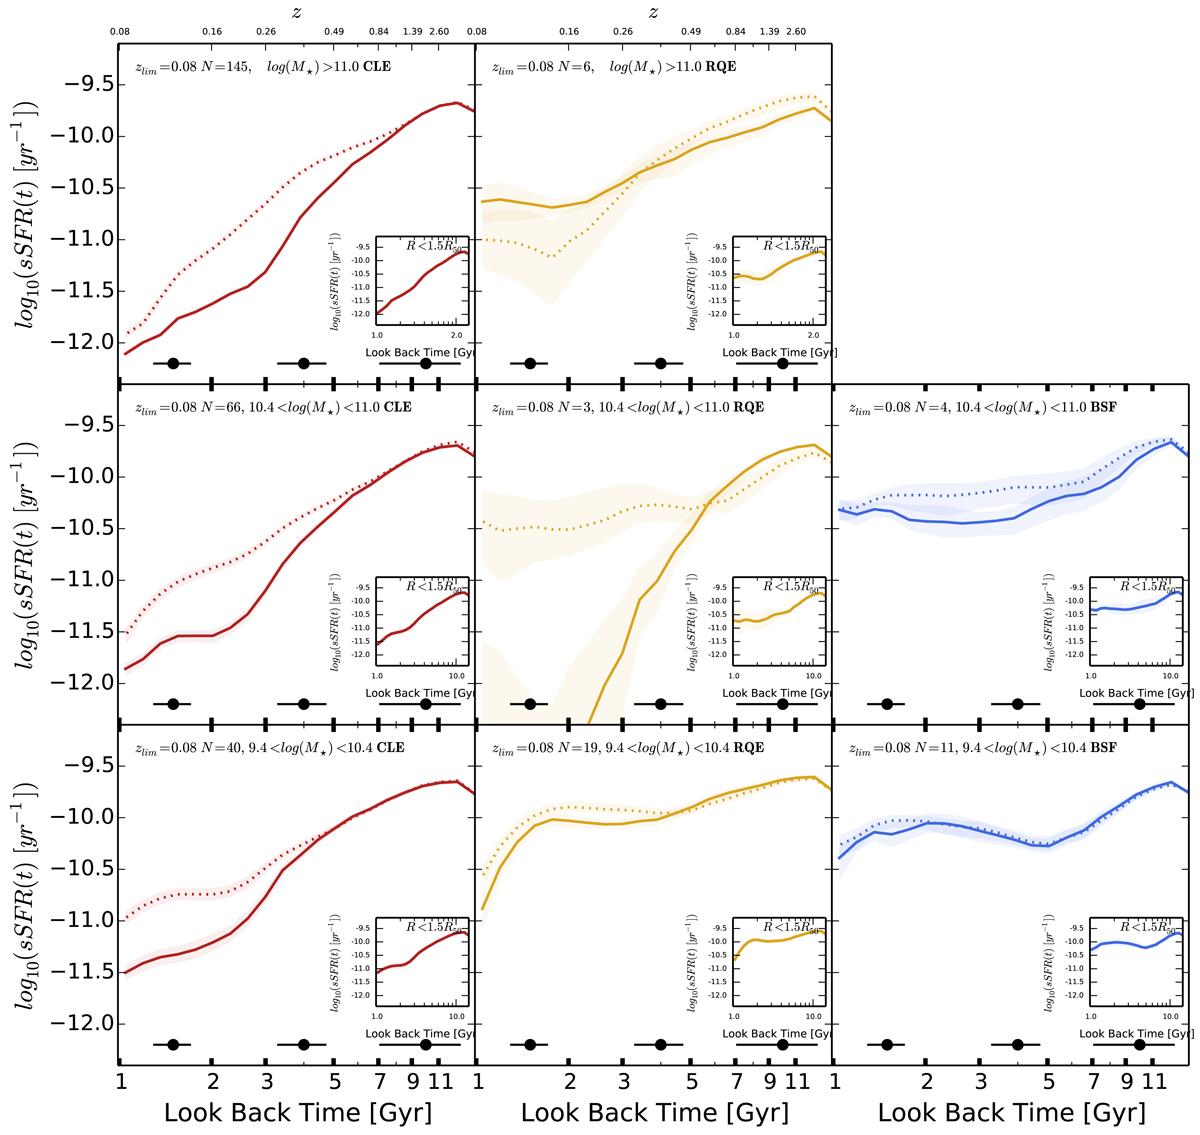
Mean sSFHs for each E type in three mass bins, which increases from the bottom to the top. The left column is for CLEs, the central column is for RQEs, and the right column is for BSFs. In each panel, the solid line corresponds to the mean sSFR within 0.5 Reff, whereas the dotted line corresponds to the mean sSFR between 1.0 and 1.5 Reff. The light shaded region and dark shaded region are the errors of the mean of the sSFRs in the inner part and the outer part of the galaxies, respectively. The horizontal error bars show the average time resolution of the SSP template stellar library at the given epoch. The inset box shows the integrated mean specific SFHs within 1.5 Reff.
Current usage metrics show cumulative count of Article Views (full-text article views including HTML views, PDF and ePub downloads, according to the available data) and Abstracts Views on Vision4Press platform.
Data correspond to usage on the plateform after 2015. The current usage metrics is available 48-96 hours after online publication and is updated daily on week days.
Initial download of the metrics may take a while.