Fig. 16.
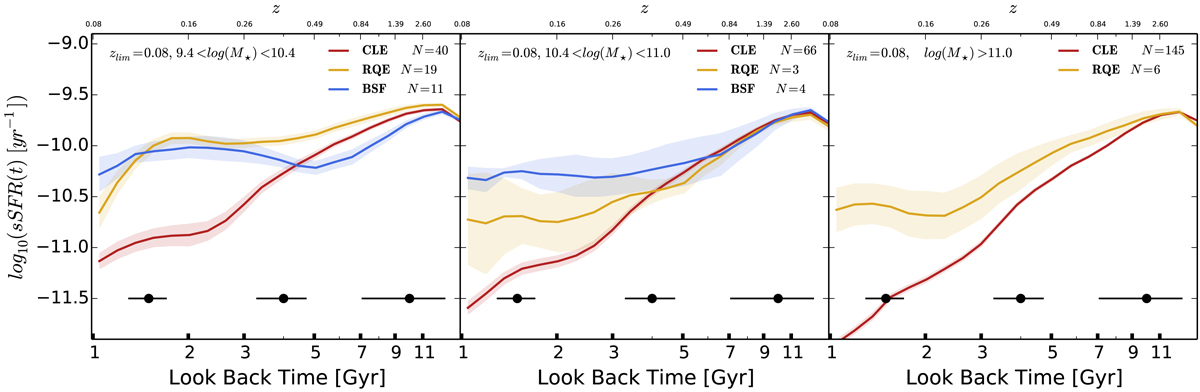
Integrated mean specific SFRs as functions of look back time, i.e., integrated mean sSFHs, within 1.5 Reff in three stellar mass bins (mass increases to the right). The sSFHs are normalized at zlim = 0.08. The red lines correspond to CLEs, the orange lines correspond to RQEs, and the blue lines correspond to BSFs. The shaded region is the error of the mean of each sSFH. The number of galaxies of each type in a given mass bin is shown in each panel. The horizontal error bars show the average time resolution of the SSP template stellar library at the given epoch.
Current usage metrics show cumulative count of Article Views (full-text article views including HTML views, PDF and ePub downloads, according to the available data) and Abstracts Views on Vision4Press platform.
Data correspond to usage on the plateform after 2015. The current usage metrics is available 48-96 hours after online publication and is updated daily on week days.
Initial download of the metrics may take a while.