Fig. 9.
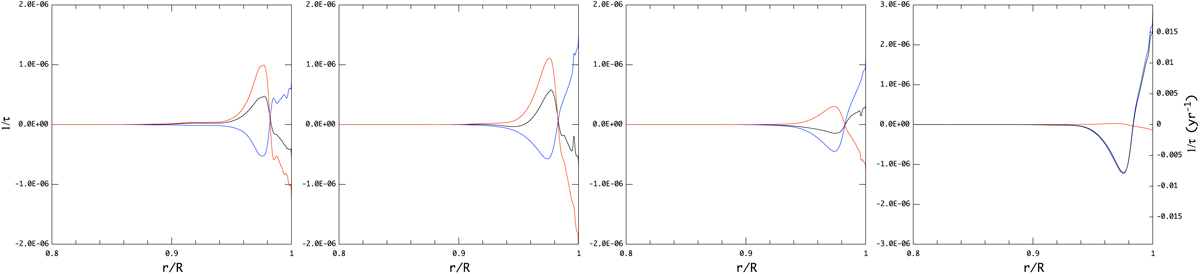
Inverse of the timescale of retrograde (red line), prograde (blue line) and the sum of the two (black line), g and r modes for a M = 15 M⊙ star with ![]() (left), 0.4 (middle left), 0.6 (middle right) and 0.8 (right), where τ is normalised to
(left), 0.4 (middle left), 0.6 (middle right) and 0.8 (right), where τ is normalised to ![]() . The value of 1/τ is proportional to the angular momentum transport. Note that the right panel (fastest rotator) has a different y-axis range to accommodate the larger 1/τ values and shows an extra y-axis on the right side in years−1.
. The value of 1/τ is proportional to the angular momentum transport. Note that the right panel (fastest rotator) has a different y-axis range to accommodate the larger 1/τ values and shows an extra y-axis on the right side in years−1.
Current usage metrics show cumulative count of Article Views (full-text article views including HTML views, PDF and ePub downloads, according to the available data) and Abstracts Views on Vision4Press platform.
Data correspond to usage on the plateform after 2015. The current usage metrics is available 48-96 hours after online publication and is updated daily on week days.
Initial download of the metrics may take a while.