Open Access
Fig. 4.
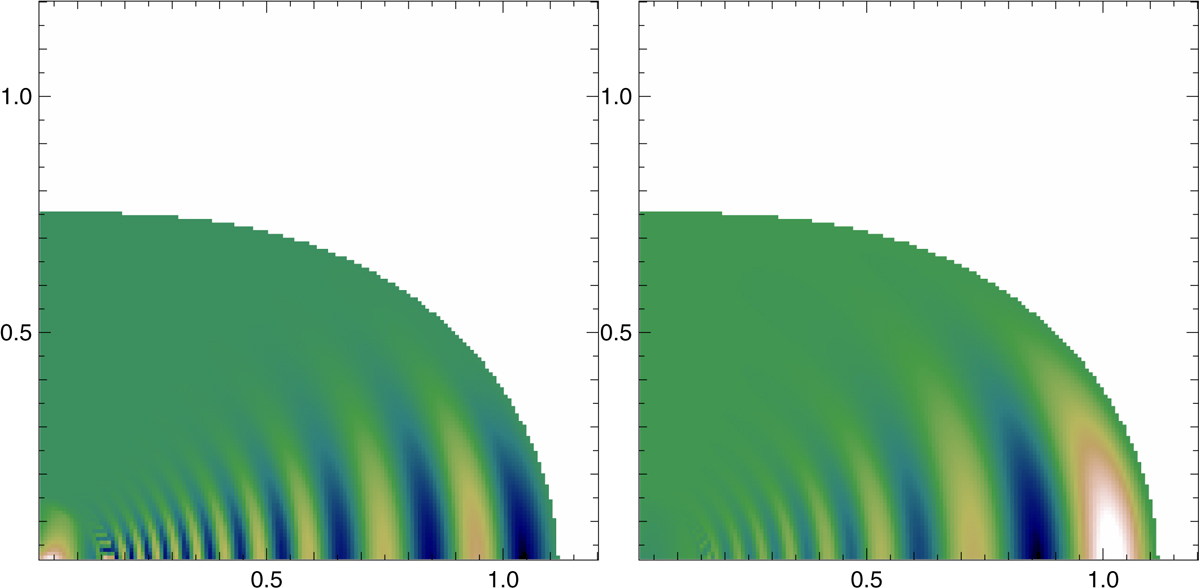
Colour maps of pulsation amplitudes for the g modes with l = 2, m = −2 and f = 2.9 c.d−1 (left) and l = 1, m = −1 and f = 1.5 c.d−1 (right), the two main frequencies observed in the CoRoT data during the outburst of HD 49330 (Huat et al. 2009).
Current usage metrics show cumulative count of Article Views (full-text article views including HTML views, PDF and ePub downloads, according to the available data) and Abstracts Views on Vision4Press platform.
Data correspond to usage on the plateform after 2015. The current usage metrics is available 48-96 hours after online publication and is updated daily on week days.
Initial download of the metrics may take a while.