Fig. A.1.
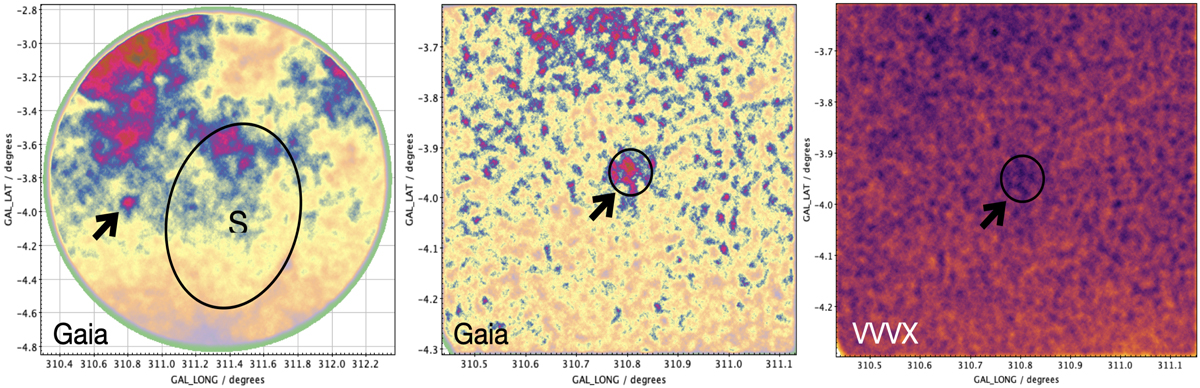
Left panel: Gaia stellar density map for a r = 2 degree field in Galactic coordinates, indicating the new GC with an arrow, along with the size of the HI emission of the Circinus galaxy (Freeman et al. 1977). Middle and right panel: density maps of the zoomed 42′×42′ region around Garro01 using optical Gaia data and VVVX near-IR data, respectively, where the circle indicates the approximate cluster size. It is important to note that the redder areas are representative of overdensities, while the yellower areas are lower densities.
Current usage metrics show cumulative count of Article Views (full-text article views including HTML views, PDF and ePub downloads, according to the available data) and Abstracts Views on Vision4Press platform.
Data correspond to usage on the plateform after 2015. The current usage metrics is available 48-96 hours after online publication and is updated daily on week days.
Initial download of the metrics may take a while.