Fig. 3
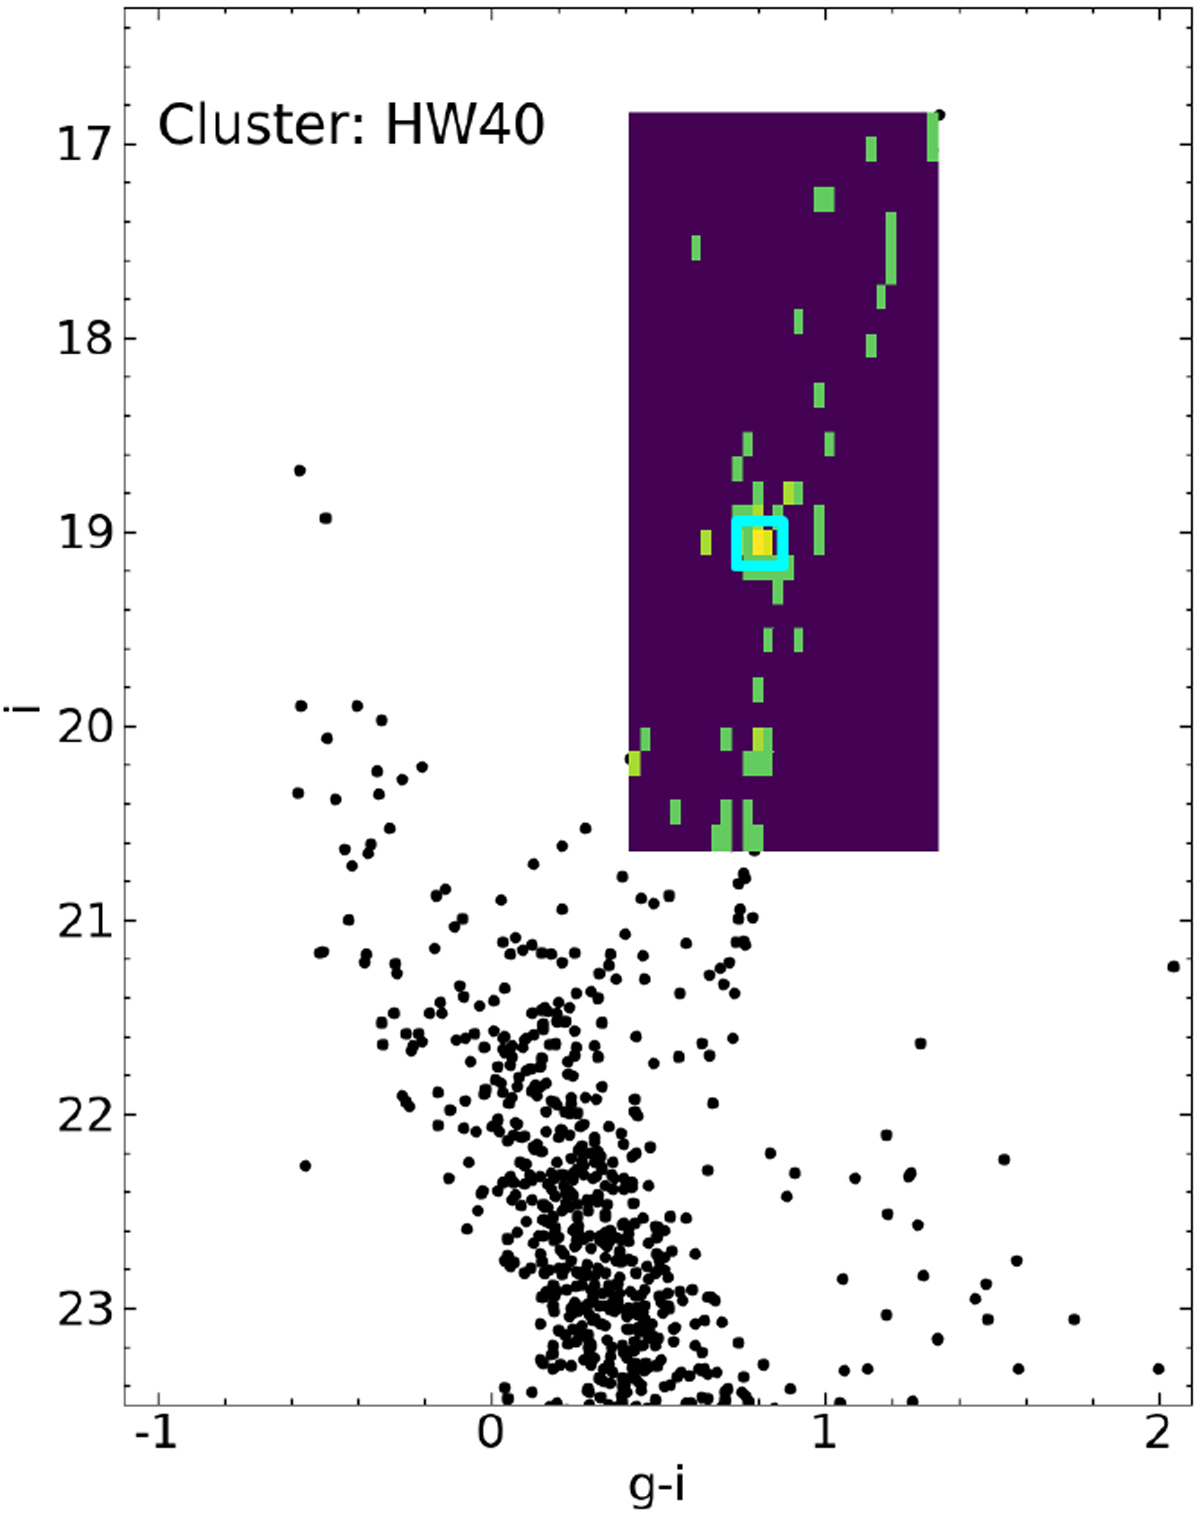
Example of RC fit for HW 40 from the calibrated SMASH DR2 gi photometry. Black dots are the stars within the cluster radius of 4.5′ (Bica et al. 2020). The selected RGB region is indicated by the coloured rectangle where the dots are replaced by the 2d histogram bins. The clear overdensity matches the fitted RC position indicated by the cyan square.
Current usage metrics show cumulative count of Article Views (full-text article views including HTML views, PDF and ePub downloads, according to the available data) and Abstracts Views on Vision4Press platform.
Data correspond to usage on the plateform after 2015. The current usage metrics is available 48-96 hours after online publication and is updated daily on week days.
Initial download of the metrics may take a while.