Fig. 1
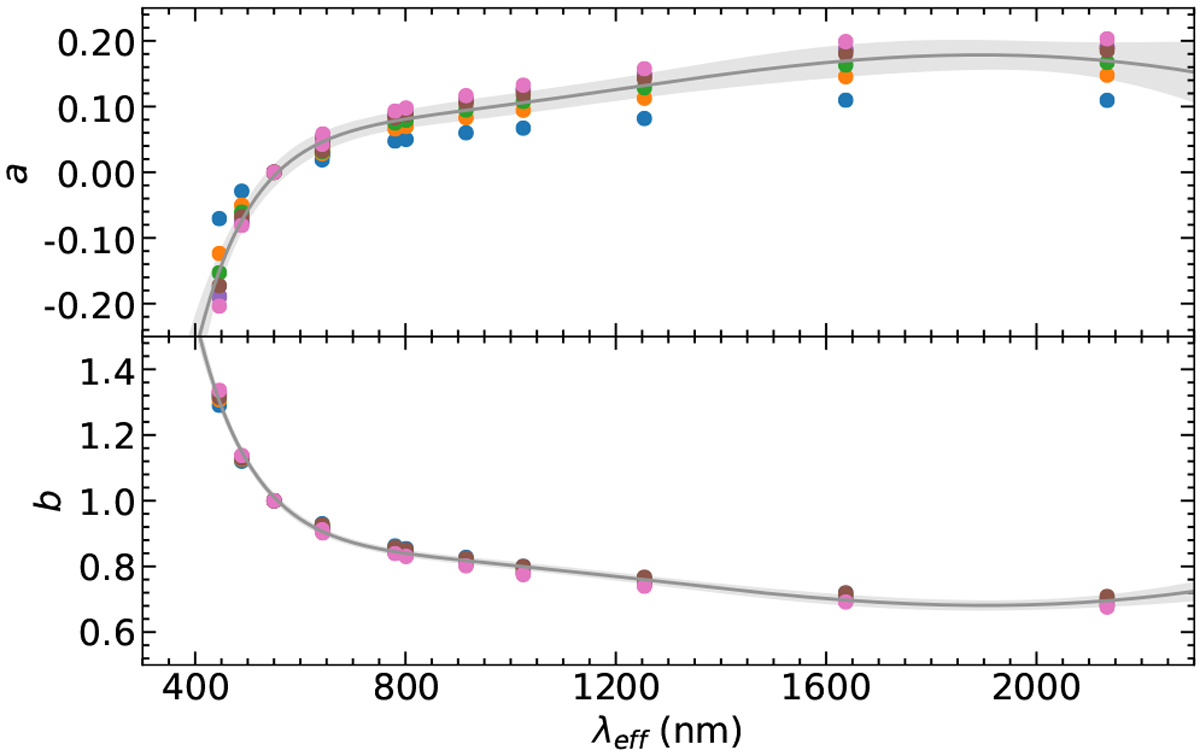
Coefficients a, b from Eq. (1) as a function of the effective wavelength for each filter m, where m = B, g, V, G, r, i, I, z, Y, J.H, Ks. We note that the filter H was included here to better constrain the fit, even though it is not present in the analysis in the rest of the paper. The fit was performed for isochrones with combinations of age and metallicity for the sample clusters from Table 1, which are represented by different colours, mostly overlapping points. The line is a polynomial fit to all points and the shaded area represents ± 3σ uncertainties.
Current usage metrics show cumulative count of Article Views (full-text article views including HTML views, PDF and ePub downloads, according to the available data) and Abstracts Views on Vision4Press platform.
Data correspond to usage on the plateform after 2015. The current usage metrics is available 48-96 hours after online publication and is updated daily on week days.
Initial download of the metrics may take a while.