Fig. 5.
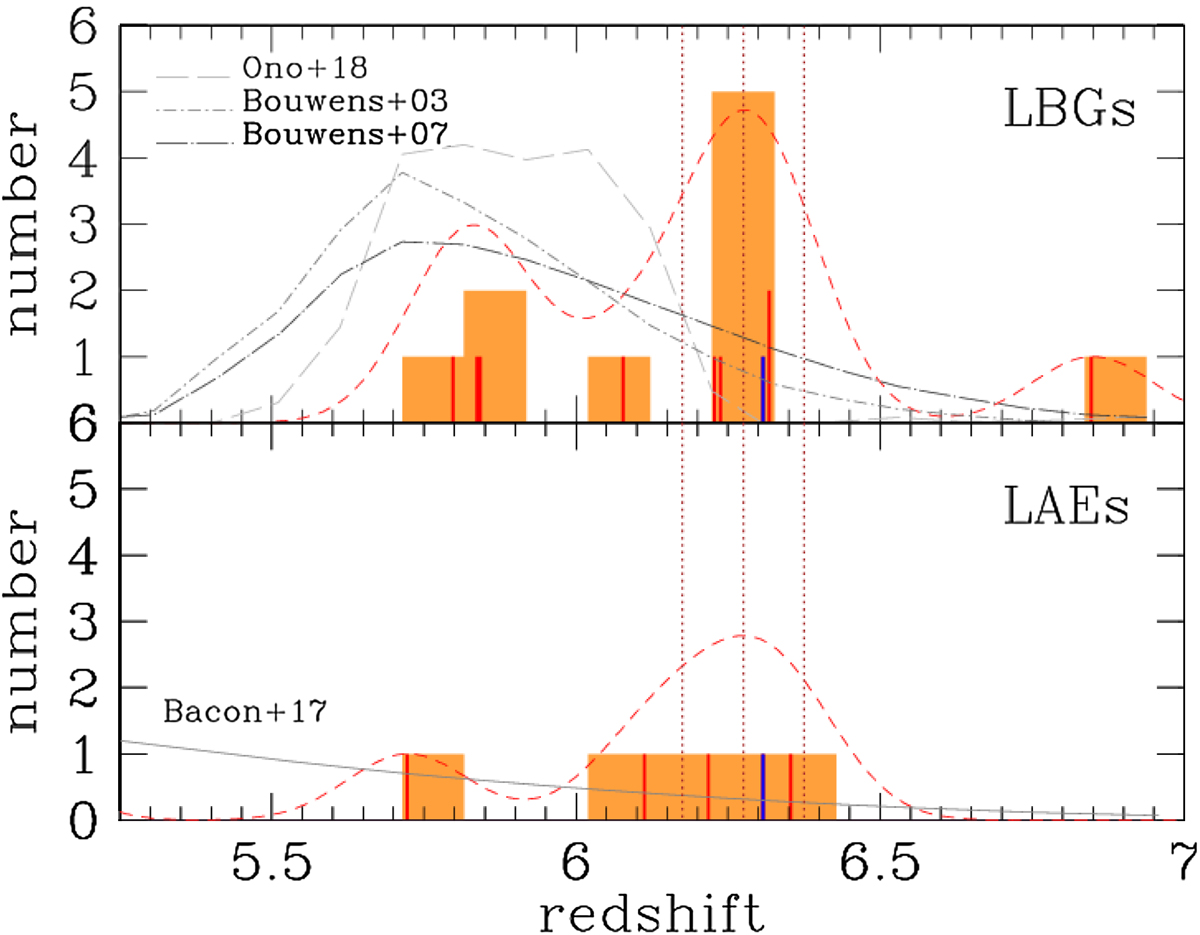
Upper panel: redshift distribution of all spectroscopically confirmed LBGs at z ∼ 6 in the J1030 field. The orange and red histogram have bins of Δz = 0.1 and 0.005, respectively. The dashed red curve has been obtained by smoothing the unbinned distribution with a Gaussian with σz = 0.1 (arbitrarily normalized). The redshift peak and Δz ± 0.1 interval used to estimate the structure significance are shown by the brown vertical dotted lines. The three gray lines show the selection function of i-band dropout samples in the literature (see labels) with selection criteria similar to ours. Lower panel: same as in the upper panel but for LAEs selected with MUSE. The gray curve is obtained by heavily smoothing the redshift distribution of LAEs observed with MUSE in the HUDF (Bacon et al. 2017). The QSO redshift (marked in blue) is included in the orange histograms in both panels.
Current usage metrics show cumulative count of Article Views (full-text article views including HTML views, PDF and ePub downloads, according to the available data) and Abstracts Views on Vision4Press platform.
Data correspond to usage on the plateform after 2015. The current usage metrics is available 48-96 hours after online publication and is updated daily on week days.
Initial download of the metrics may take a while.