Fig. 3.
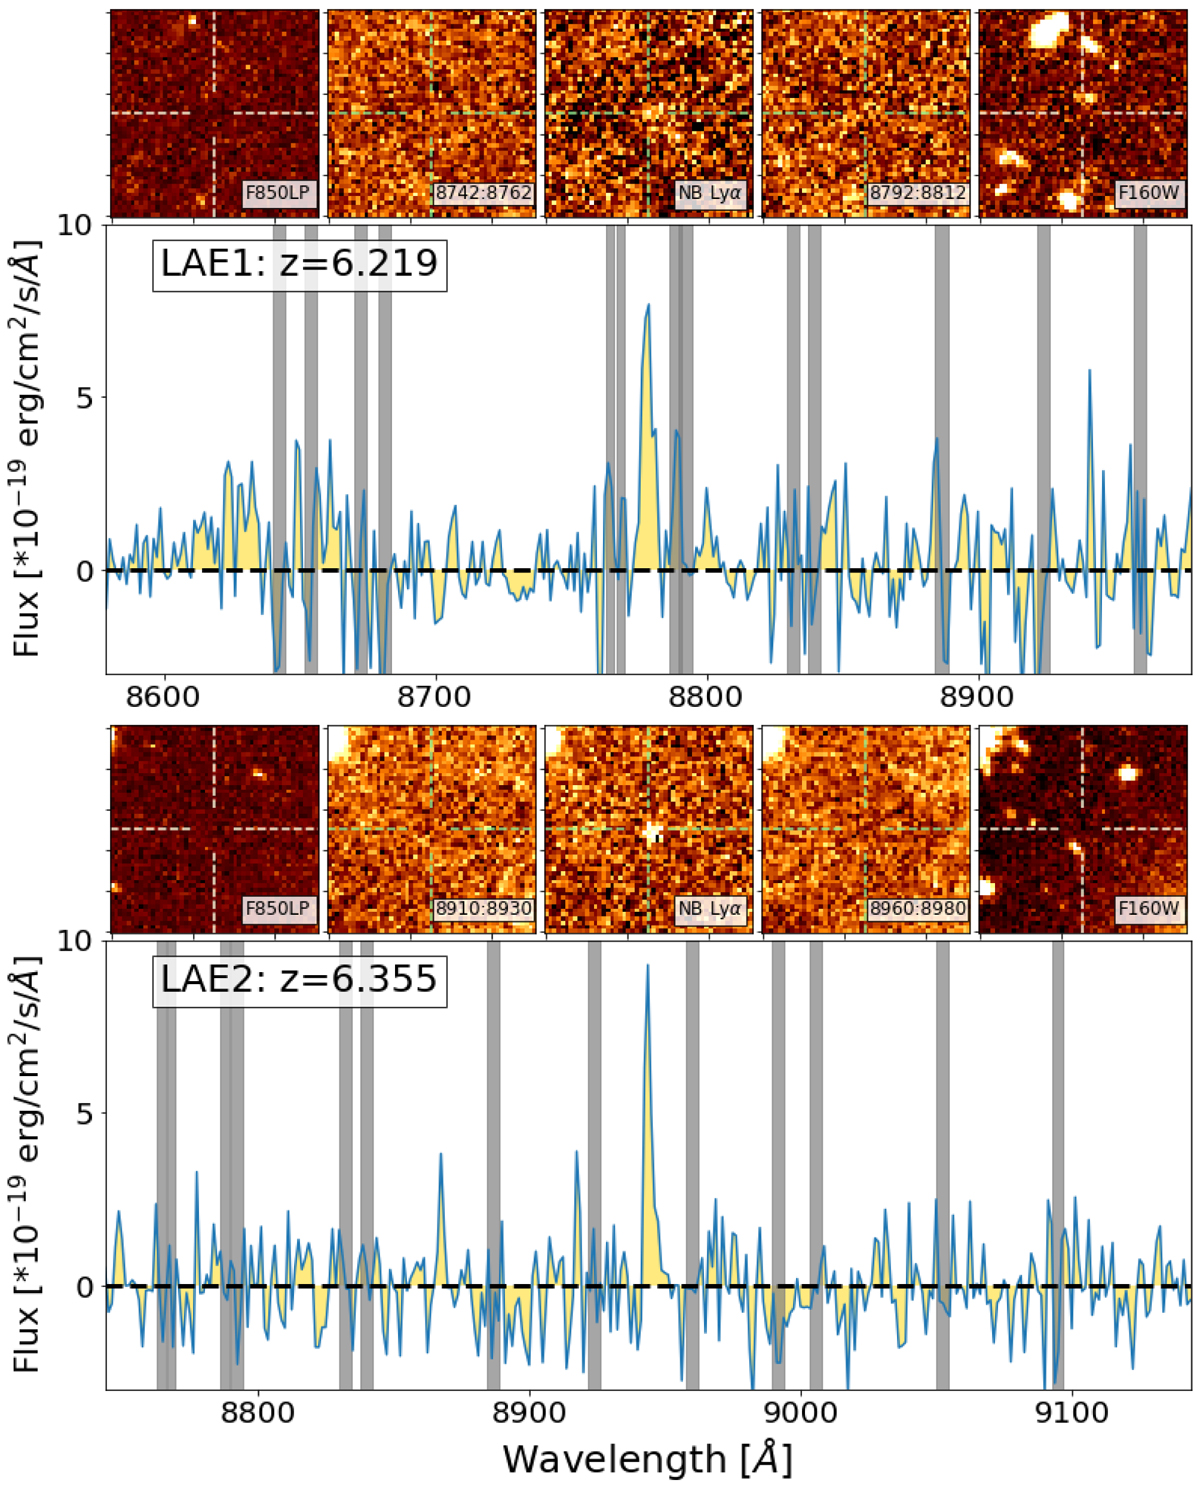
MUSE spectra of the two LAEs in the LSS (see Table 1) are displayed in two panels. In each panel, the top row shows, from left to right, the HST/ACS F850LP image, three MUSE reconstructed narrow-band images (20 Å-wide), and the HST/Wide Field Camera 3 (WFC3) F160W image. The images are 10″ wide and the source position is indicated by cross-hairs. In the bottom row, the extracted 1D spectrum is shown in a 400 Å-wide interval around the Lyα line, with noisy regions in the MUSE cube affected by the sky line subtraction highlighted by gray bands.
Current usage metrics show cumulative count of Article Views (full-text article views including HTML views, PDF and ePub downloads, according to the available data) and Abstracts Views on Vision4Press platform.
Data correspond to usage on the plateform after 2015. The current usage metrics is available 48-96 hours after online publication and is updated daily on week days.
Initial download of the metrics may take a while.