Fig. 1.
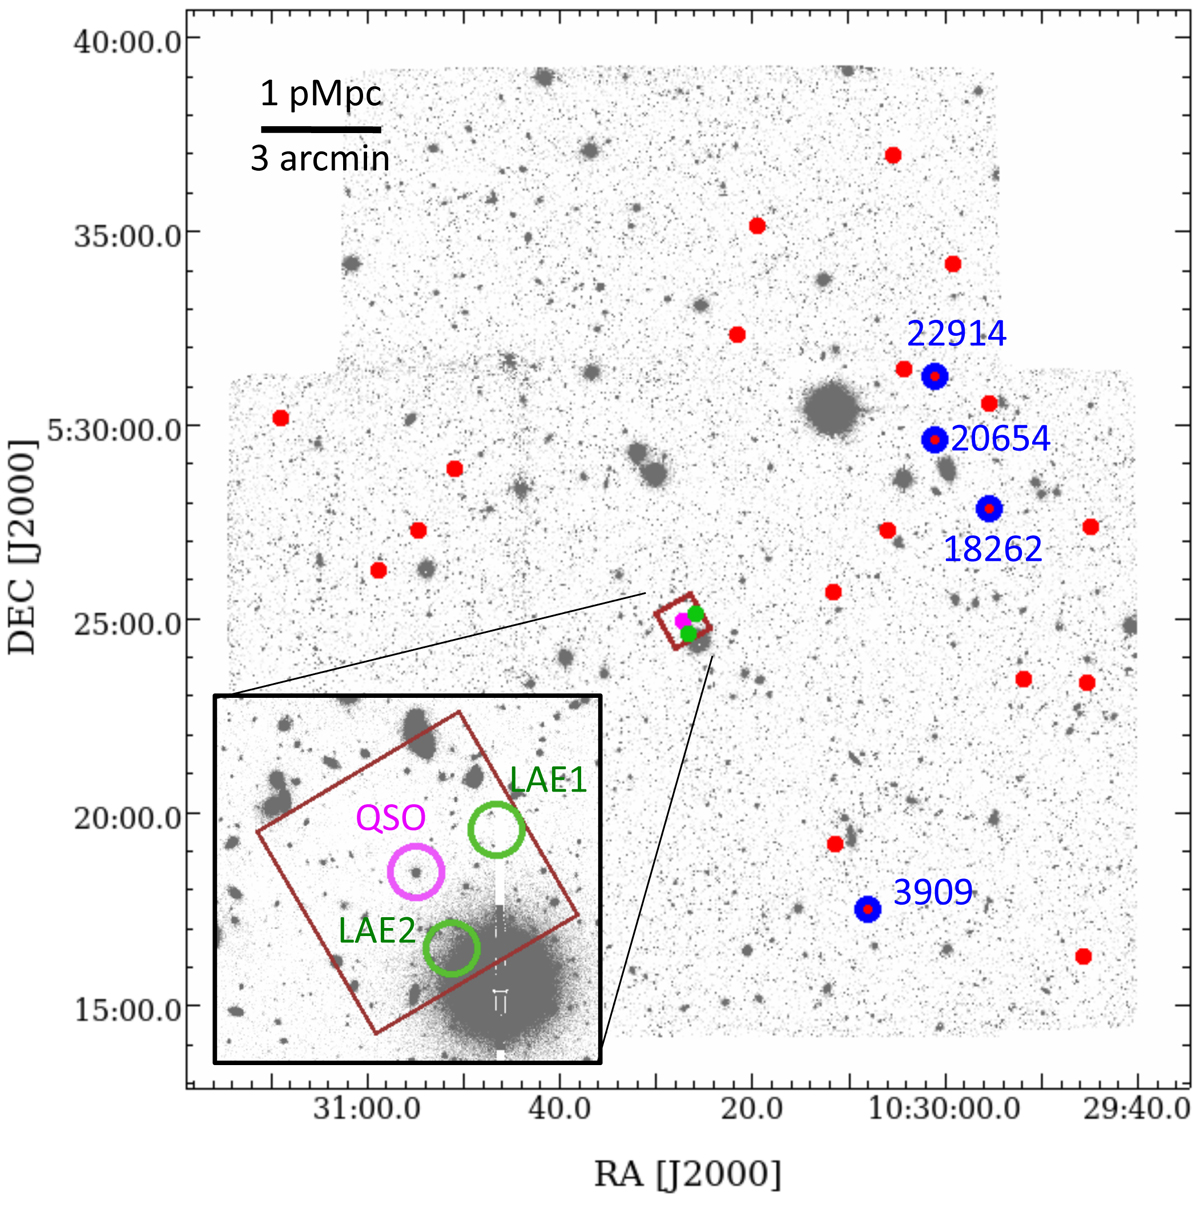
Sky distribution of the LBG sample (red dots) overplotted to the LBT/LBC z-band image of the field. The spectroscopically confirmed members of the LSS at the QSO redshift are marked in blue and labeled with their ID. The position of the two LAEs in the LSS discovered by MUSE is marked by green points. The MUSE field of view (FOV) is shown as a brown square. The position of the QSO is shown in magenta. The inset shows a zoom on the sky region around the MUSE field.
Current usage metrics show cumulative count of Article Views (full-text article views including HTML views, PDF and ePub downloads, according to the available data) and Abstracts Views on Vision4Press platform.
Data correspond to usage on the plateform after 2015. The current usage metrics is available 48-96 hours after online publication and is updated daily on week days.
Initial download of the metrics may take a while.