Fig. 8
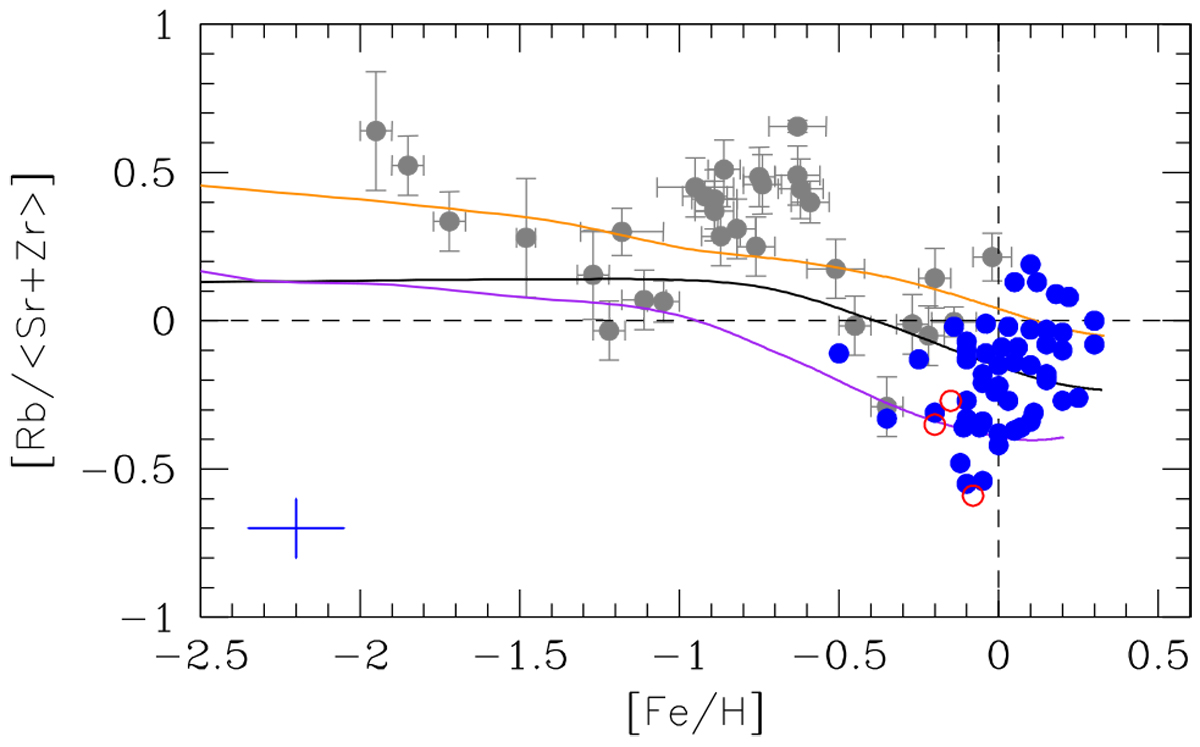
Same as Fig. 5 but for [Rb/⟨Sr+Zr⟩] vs. [Fe/H]. Blue dots are M dwarfs in this study. Grey dots corresponds to the giants and dwarfs stars analysed in common by Gratton & Sneden (1994), Tomkin & Lambert (1999), and Mishenina et al. (2019). Red open circles are stars in which Rb lines may be affected by the magnetic field. Coloured solid lines are the GCE predictions as in Fig. 5. The black solid line shows the GCE prediction when the weak s-process is inhibited in massive stars (i.e. no rotation).
Current usage metrics show cumulative count of Article Views (full-text article views including HTML views, PDF and ePub downloads, according to the available data) and Abstracts Views on Vision4Press platform.
Data correspond to usage on the plateform after 2015. The current usage metrics is available 48-96 hours after online publication and is updated daily on week days.
Initial download of the metrics may take a while.