Fig. 5
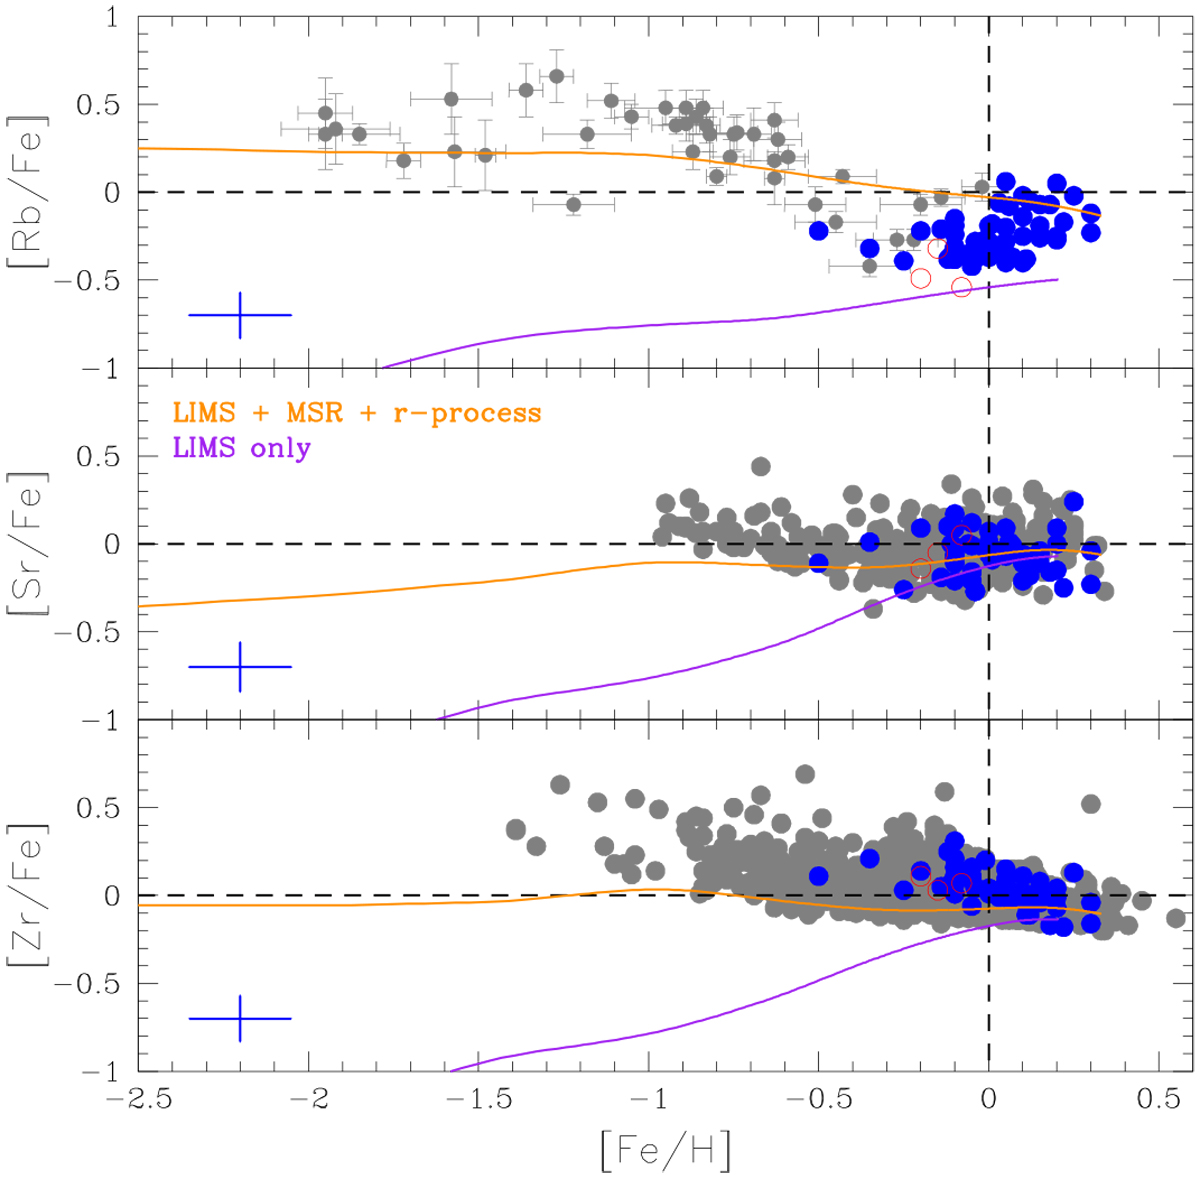
[Rb,Sr,Zr/Fe] vs. [Fe/H] diagrams, from top to bottom. In the three panels, blue filled circles are our program stars. Top panel: grey dots with error bars are the [Rb/Fe] ratios derived in halo and disc giant and dwarf stars by Gratton & Sneden (1994) and Tomkin & Lambert (1999). Middle and bottom panels: grey dots are the [Sr/Fe] ratios derived by Mishenina et al. (2019), and [Zr/Fe] ratios by Battistini & Bensby (2016) and Delgado Mena et al. (2017), both in thin disc dwarf stars. A typical error bar in the [X/Fe] ratios for our M dwarfs is shown in the bottom left corner of each panel. For dwarf and giant stars (grey dots) the error bars are slightly smaller, which we have omitted for clarity. The red open circles in all the panels are the stars in which the Rb lines may be affected by magnetic field. Continuous lines are theoretical GCE predictions by Prantzos et al. (2018, 2020). Orange lines include the contributions from low- and intermediate-mass stars (LIMS), rotating massive stars (MSR), and the r-proces. Magenta lines include only LIMS.
Current usage metrics show cumulative count of Article Views (full-text article views including HTML views, PDF and ePub downloads, according to the available data) and Abstracts Views on Vision4Press platform.
Data correspond to usage on the plateform after 2015. The current usage metrics is available 48-96 hours after online publication and is updated daily on week days.
Initial download of the metrics may take a while.