Free Access
Fig. 4
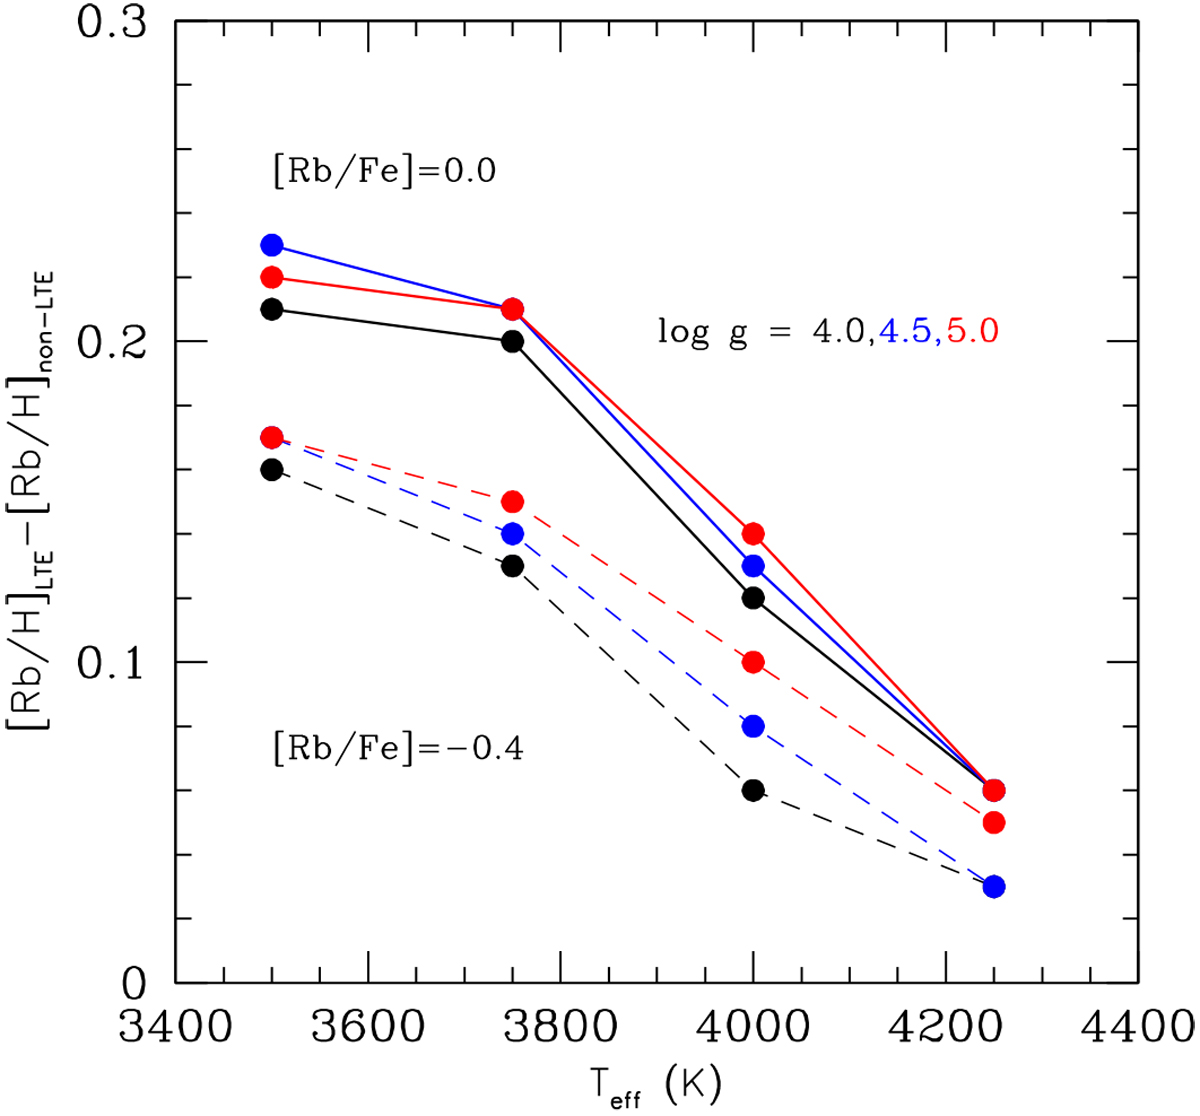
Difference between the LTE and non-LTE Rb abundances derived from the Rb I λ7800 Å line for typical Teff and log g (colour coded) in our sample stars. Solid and dashed lines correspond to [Rb/Fe] ratios of 0.0 and − 0.4, respectively (see text for details).
Current usage metrics show cumulative count of Article Views (full-text article views including HTML views, PDF and ePub downloads, according to the available data) and Abstracts Views on Vision4Press platform.
Data correspond to usage on the plateform after 2015. The current usage metrics is available 48-96 hours after online publication and is updated daily on week days.
Initial download of the metrics may take a while.