Fig. 2
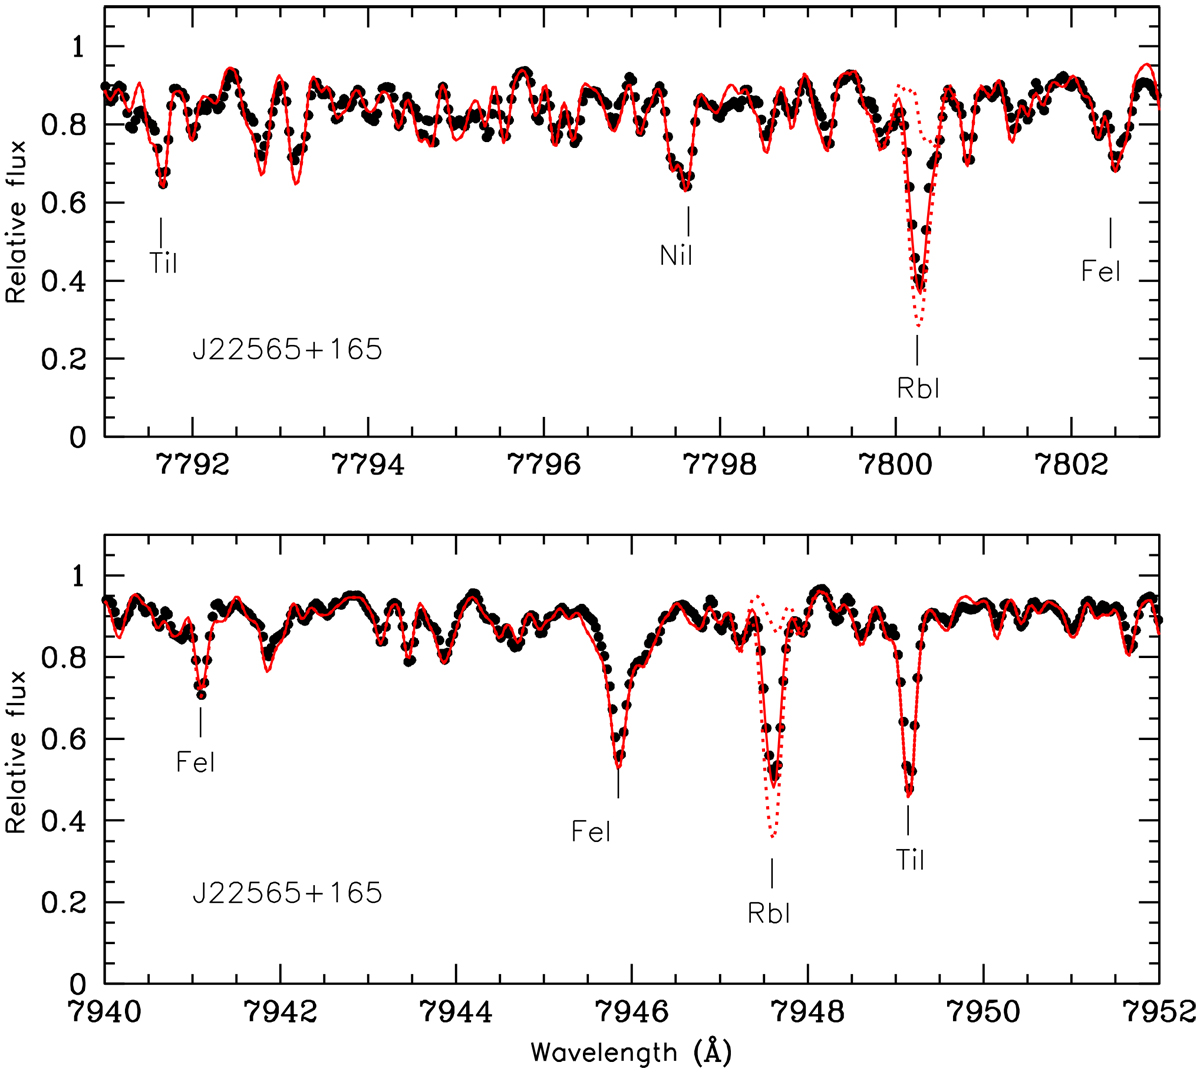
Same as Fig. 1 but for the regions around Rb I λ7800 Å (top panel) and Rb I λ7947 Å (bottom panel) for the M1.5 V star J22565+165 (HD 216899). Red solid, and dotted curves show theoretical spectra computed with log ɛ(Rb) = 2.8, 2.55 (best fit), and no Rb, respectively. Some Ti I, Ni I, and Fe I lines are marked and labelled. In these regions, the pseudo-continuum is reduced mainly due to the contribution of TiO.
Current usage metrics show cumulative count of Article Views (full-text article views including HTML views, PDF and ePub downloads, according to the available data) and Abstracts Views on Vision4Press platform.
Data correspond to usage on the plateform after 2015. The current usage metrics is available 48-96 hours after online publication and is updated daily on week days.
Initial download of the metrics may take a while.