Fig. 1
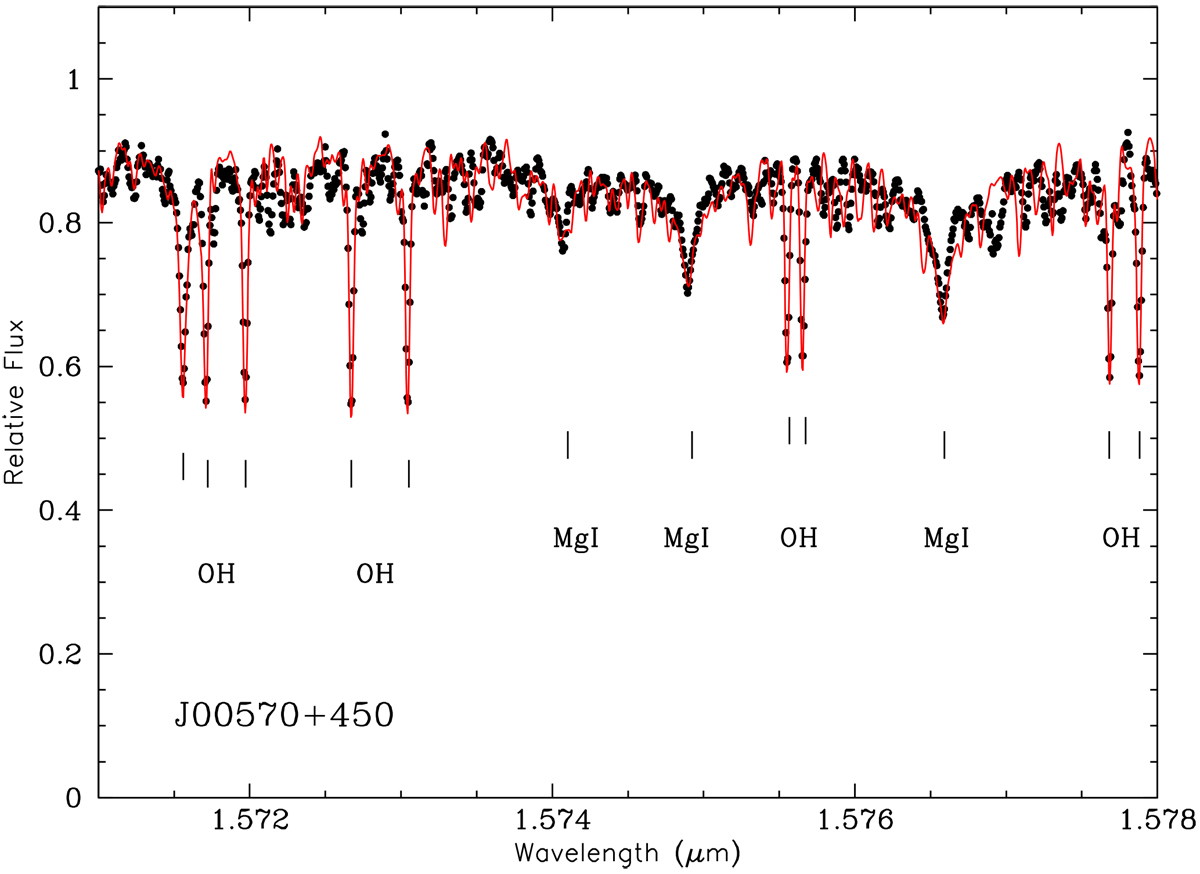
Comparison of the observed (black dots) and synthetic (solid red line) spectra for the M3.0 V star J00570+450 (G 172–30) in the spectral region around λλ15 750 Å. Some OH lines, from which the O abundance was derived, and less intense Mg I lines near λλλ15740, 15749, and 15765 Å are markedand labelled. In this region the pseudo-continuum is reduced mainly due to the contribution of an H2O veil.
Current usage metrics show cumulative count of Article Views (full-text article views including HTML views, PDF and ePub downloads, according to the available data) and Abstracts Views on Vision4Press platform.
Data correspond to usage on the plateform after 2015. The current usage metrics is available 48-96 hours after online publication and is updated daily on week days.
Initial download of the metrics may take a while.