Free Access
Fig. 5
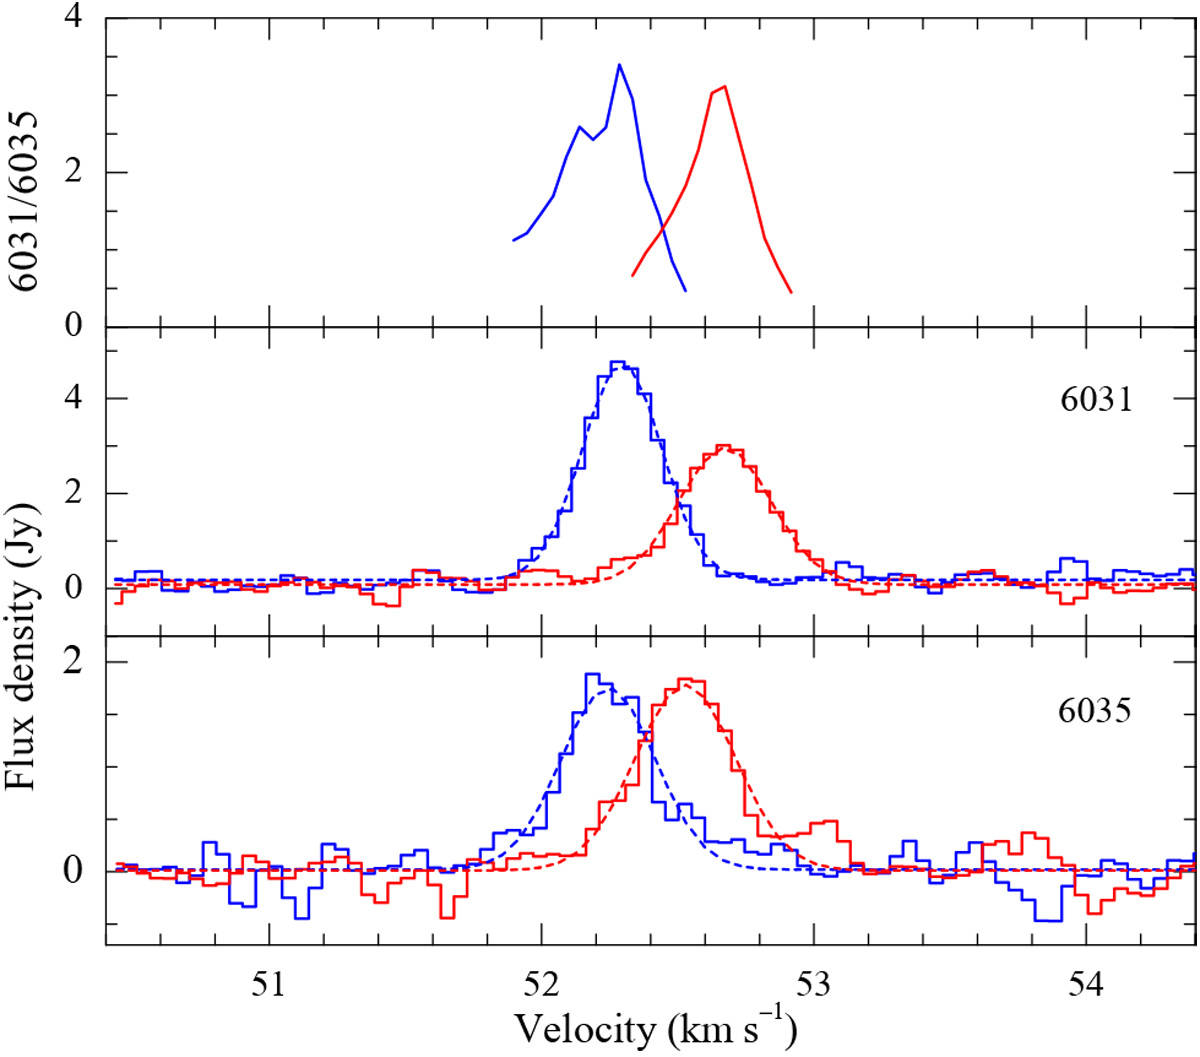
Part of OH spectra in G49.490−00.388 showing a rare case where the maser intensity at 6031 MHz surpasses that at 6035 MHz. Upper panel: line ratio for each polarisation. Blue and red lines are LHC and RHC polarisation, respectively. The dashed lines correspond to the Gaussian fits.
Current usage metrics show cumulative count of Article Views (full-text article views including HTML views, PDF and ePub downloads, according to the available data) and Abstracts Views on Vision4Press platform.
Data correspond to usage on the plateform after 2015. The current usage metrics is available 48-96 hours after online publication and is updated daily on week days.
Initial download of the metrics may take a while.