Fig. 3
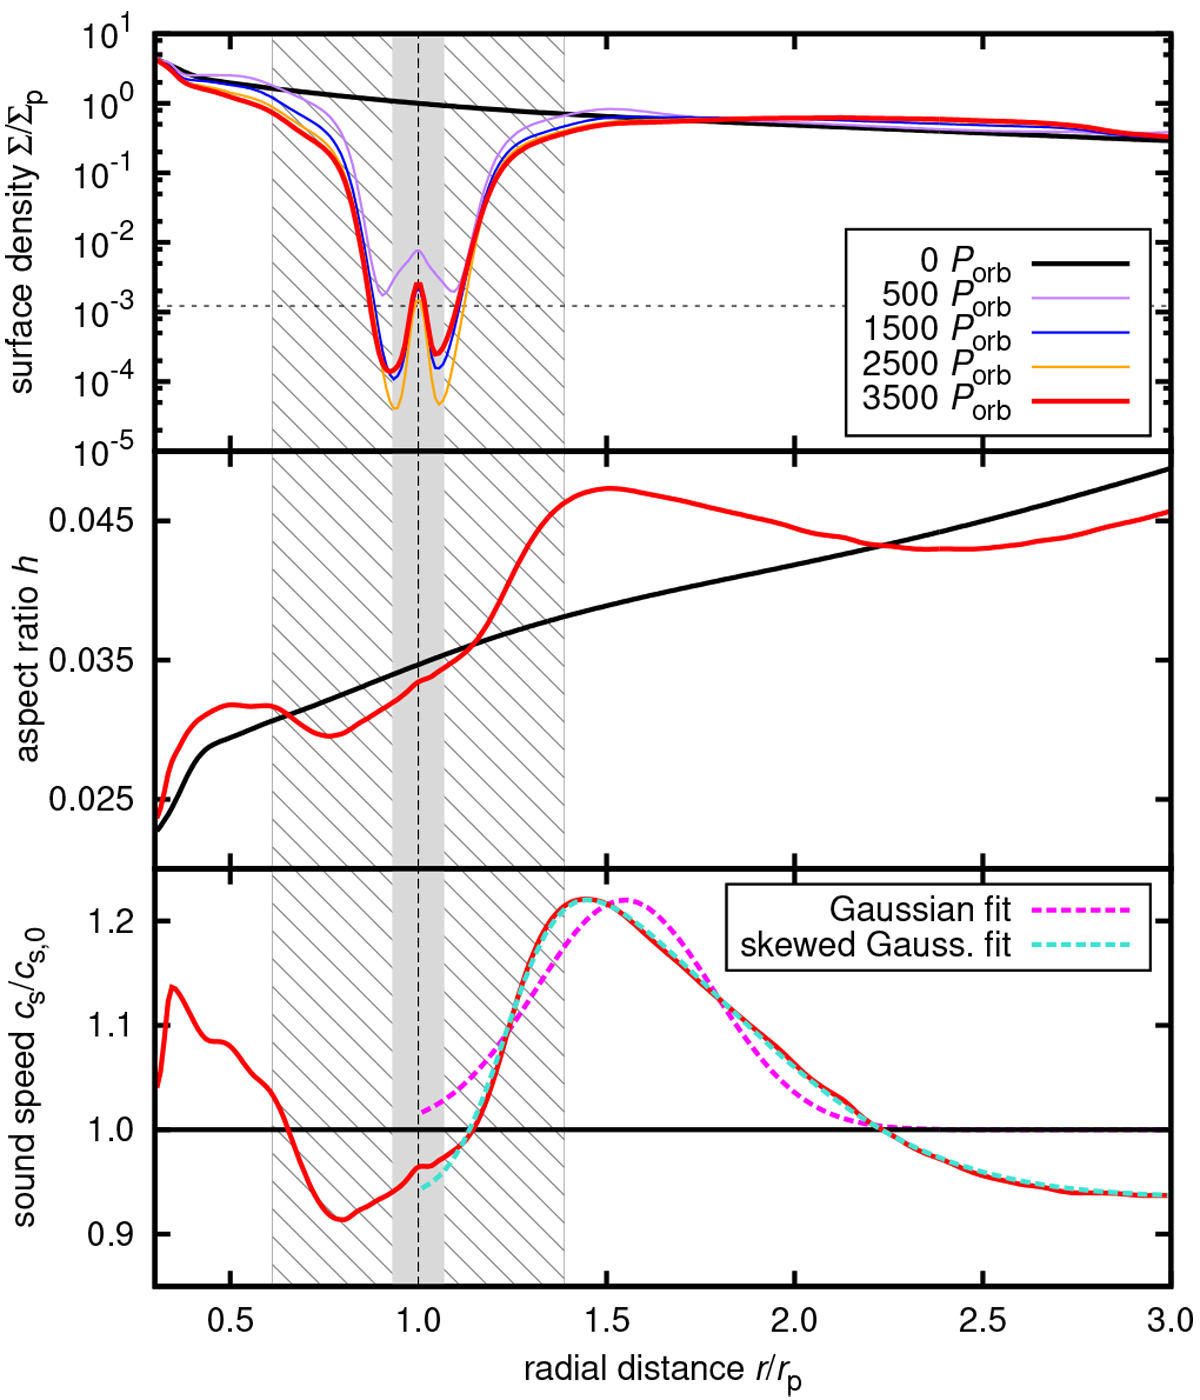
Azimuthally averaged profiles of the surface density perturbation Σ∕Σp (top), aspectratio h (middle), and midplane sound speed perturbation cs∕cs,0 (bottom) during the course of the fiducial simulation with irradiation. Solid curves corresponding to various simulation times are distinguished by colour. The vertical dashed line is the planet location, the grey vertical band marks the Hill sphere, and the hatched vertical band shows the extent of the gap width (following the definition of Kanagawa et al. 2016). The horizontal dotted line marks the gap depth according to Kanagawa et al. (2016). Dashed curves in the bottom panel are the least-squares fits of the Gaussian function of Hallam & Paardekooper (2018; magenta) and the skewed Gaussian (turquoise) given by Eq. (27). The peak of h and cs can be directly related to the increased heating of the outer gap edge by stellar irradiation (see Fig. 2).
Current usage metrics show cumulative count of Article Views (full-text article views including HTML views, PDF and ePub downloads, according to the available data) and Abstracts Views on Vision4Press platform.
Data correspond to usage on the plateform after 2015. The current usage metrics is available 48-96 hours after online publication and is updated daily on week days.
Initial download of the metrics may take a while.