Fig. 2
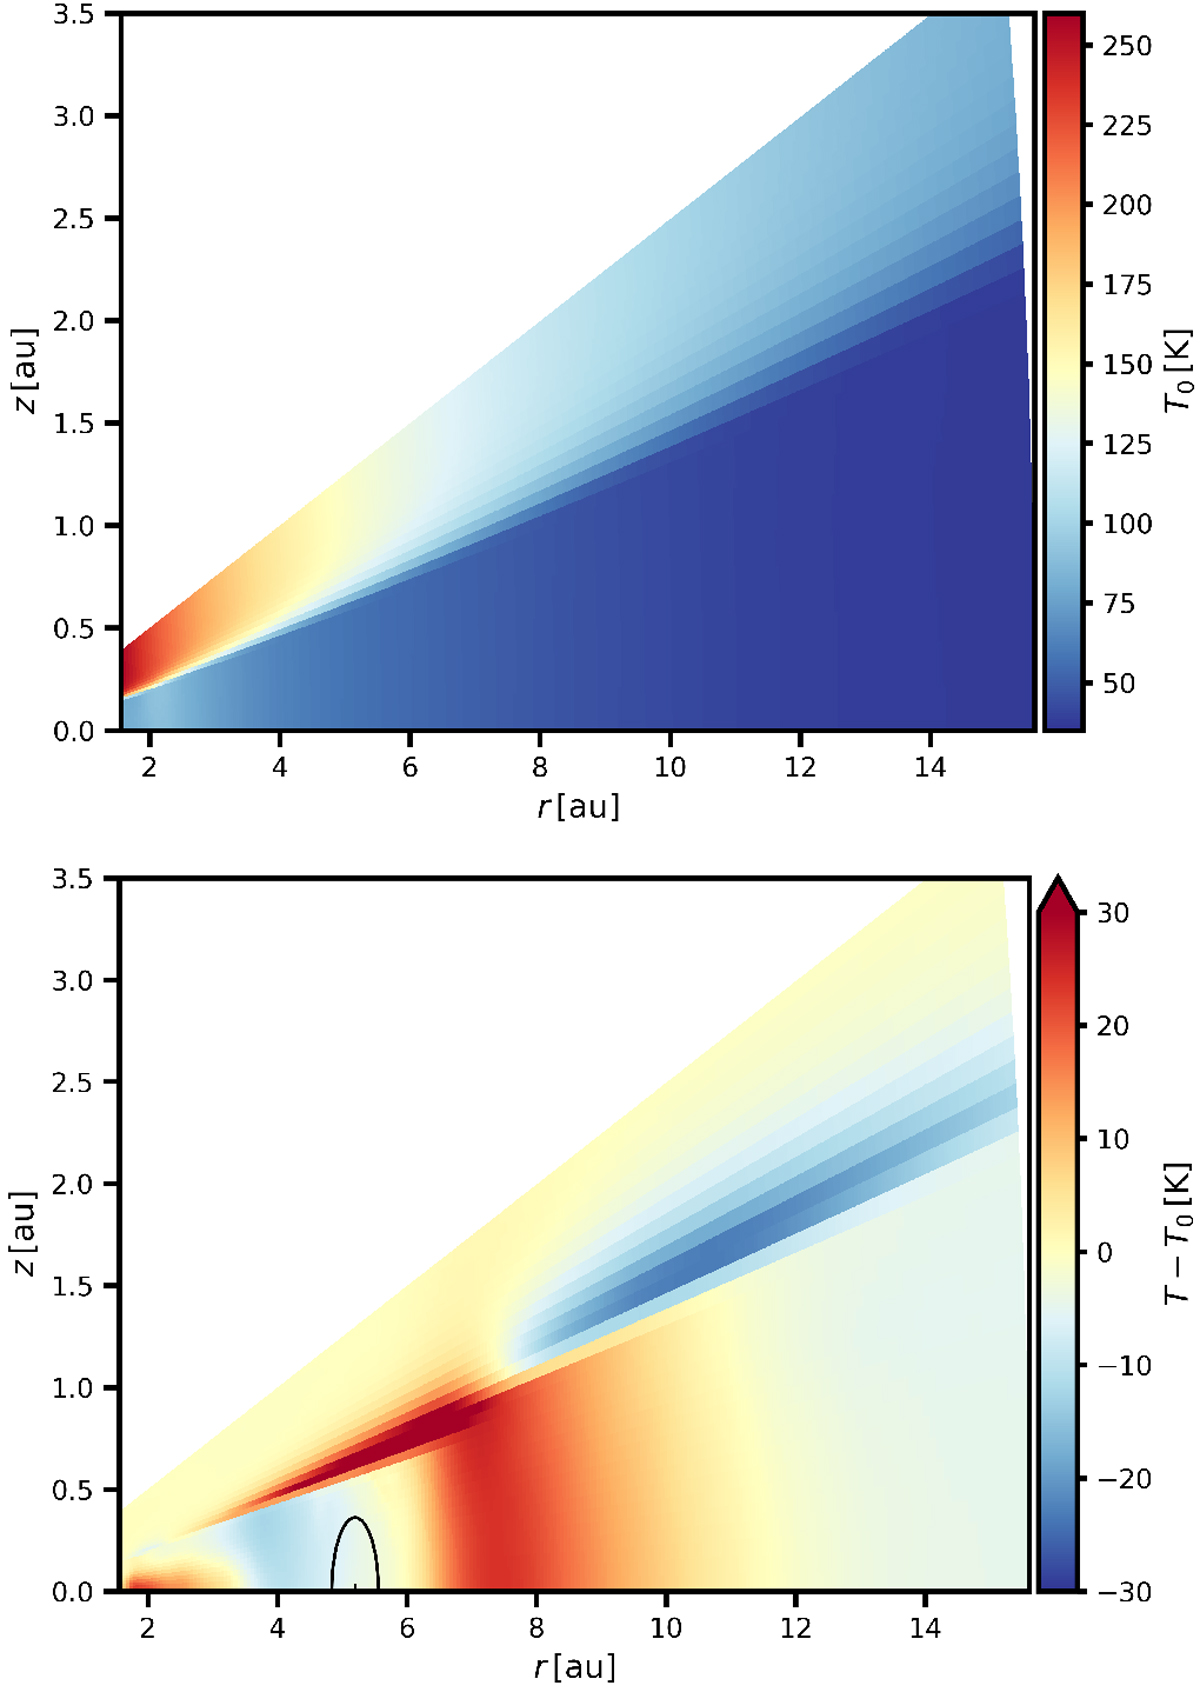
Temperature T0 before planet insertion (top) and the temperature difference T − T0 after gap opening (bottom; taken at t = 3500 Porb) in the vertical plane of the disk. The quantities are azimuthally averaged. The Hill sphere and the location of a Jupiter-mass planet are displayed in the bottom panel. We point out that the scale of the vertical axis is exaggerated. The temperature increase due to the irradiation of the outer gap edge is clearly visible in the bottom panel.
Current usage metrics show cumulative count of Article Views (full-text article views including HTML views, PDF and ePub downloads, according to the available data) and Abstracts Views on Vision4Press platform.
Data correspond to usage on the plateform after 2015. The current usage metrics is available 48-96 hours after online publication and is updated daily on week days.
Initial download of the metrics may take a while.