Fig. 1
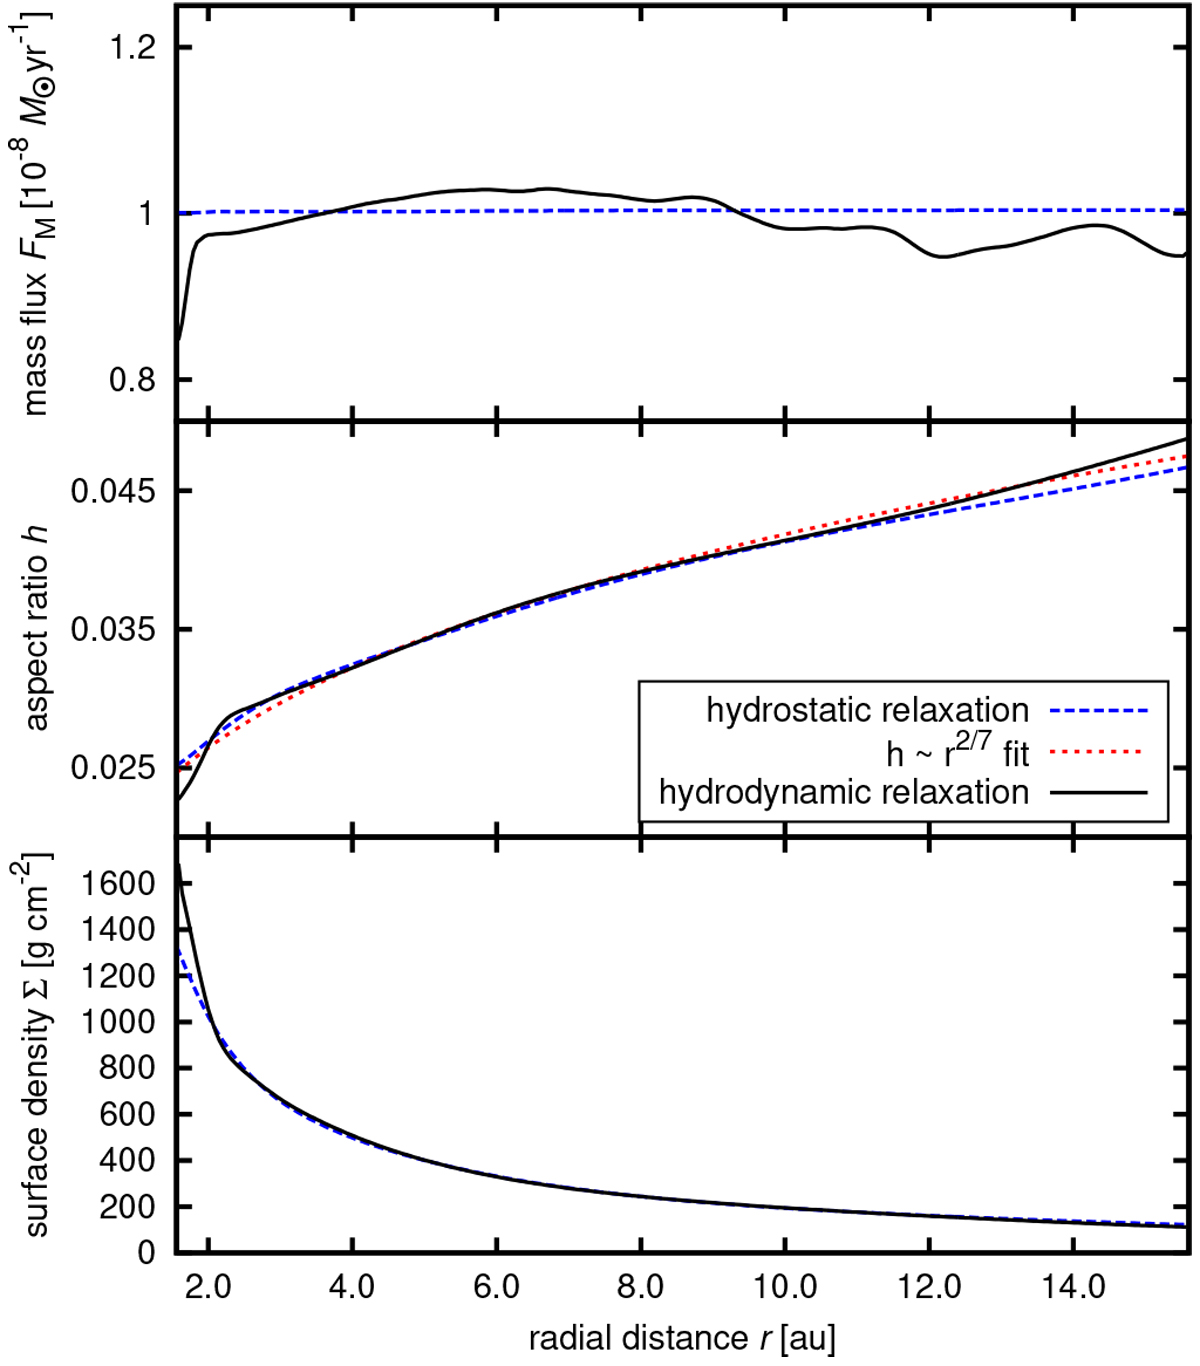
Radial profiles of the accretion mass flux FM (top), aspectratio h (middle), and surface density Σ (bottom) after the hydrostatic relaxation (dashed blue curve) and hydrodynamic relaxation (solid black curve). The latter spanned 6000 Porb. The red dotted curve shows a fit of the h ∝ r2∕7 dependence to the result of the hydrodynamic relaxation. The profiles demonstrate that our equilibrium disk has its global thermodynamics governed by passive heating (stellar irradiation) and its accretion rate is almost uniform.
Current usage metrics show cumulative count of Article Views (full-text article views including HTML views, PDF and ePub downloads, according to the available data) and Abstracts Views on Vision4Press platform.
Data correspond to usage on the plateform after 2015. The current usage metrics is available 48-96 hours after online publication and is updated daily on week days.
Initial download of the metrics may take a while.