Fig. B.1.
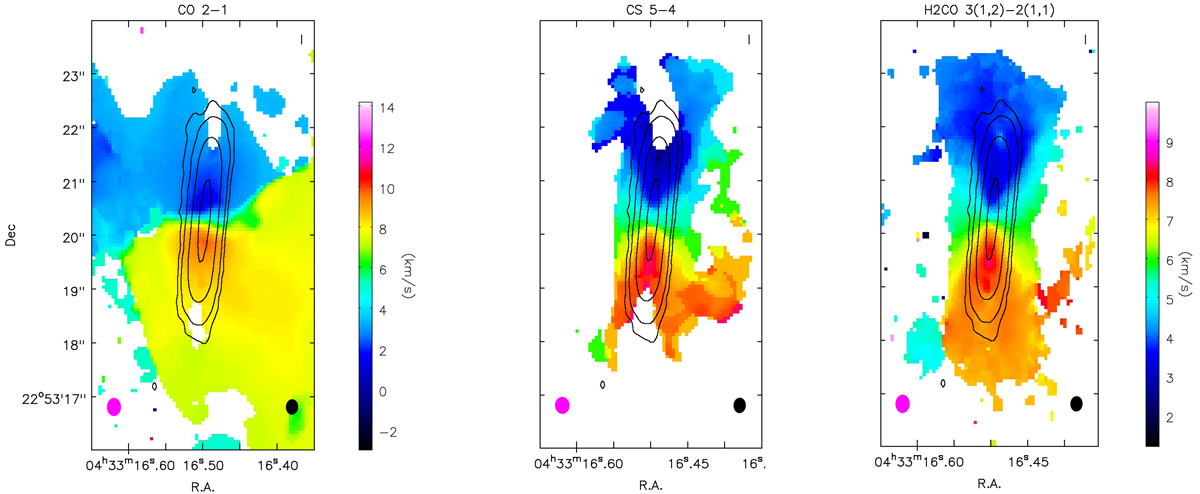
Moment 1 maps of CO 2−1 (velocity scale from −3 to +14.2 km s−1), CS 5−4, and H2CO 31, 2 − 21, 1 (velocity scale from +1.2 to +10 km s−1). Black contours indicate the continuum emission at 1.3 mm (3σ, 10σ, 50σ, and 200σ intensity levels, with σ = 0.05 mJy beam−1). The magenta (black) ellipses on the bottom-left (right) corners show the line (continuum) beam.
Current usage metrics show cumulative count of Article Views (full-text article views including HTML views, PDF and ePub downloads, according to the available data) and Abstracts Views on Vision4Press platform.
Data correspond to usage on the plateform after 2015. The current usage metrics is available 48-96 hours after online publication and is updated daily on week days.
Initial download of the metrics may take a while.