Fig. 3.
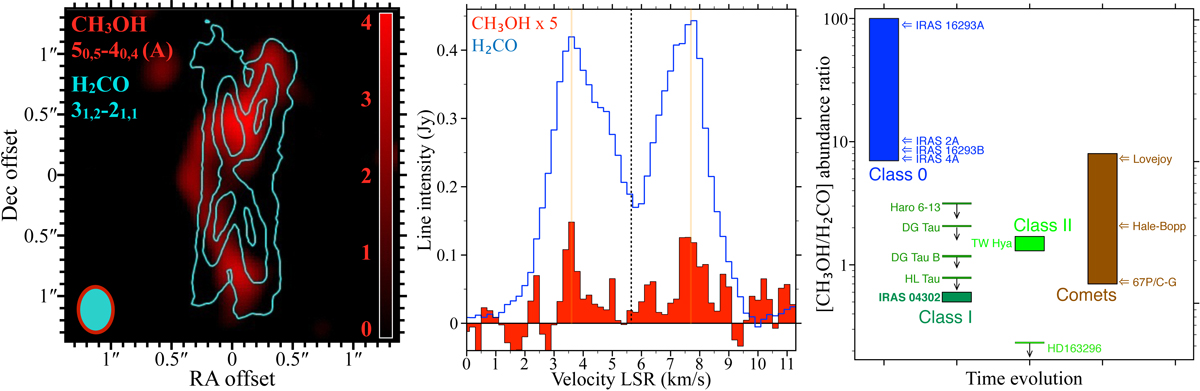
Left: CH3OH 50, 5 − 40, 4 (A) moment 0 map. The color wedge shows the intensity in units of mJy beam−1 km s−1. The cyan contours indicate the H2CO 31, 2 − 21, 1 emission of Fig. 1 at 20, 40, and 60 mJy beam −1. The beam sizes are shown at the bottom left with the relative colors. Middle: spectral profiles of the H2CO and CH3OH lines integrated over the H2CO emitting area. The CH3OH profile is multiplied by 5. The solid-vertical lines indicate the peaks of the H2CO profile and correspond to the peaks of the CH3OH line. The dashed line indicates the source systemic velocity (Vsys = +5.6 km s−1). Right: [CH3OH]/[H2CO] abundance ratio inferred for IRAS 04302 is compared with literature values inferred for Class 0 hot corinos, other Class I or early Class II disks observed by ALMA-DOT, Class II disks, and comets (references in the text).
Current usage metrics show cumulative count of Article Views (full-text article views including HTML views, PDF and ePub downloads, according to the available data) and Abstracts Views on Vision4Press platform.
Data correspond to usage on the plateform after 2015. The current usage metrics is available 48-96 hours after online publication and is updated daily on week days.
Initial download of the metrics may take a while.