Fig. 1.
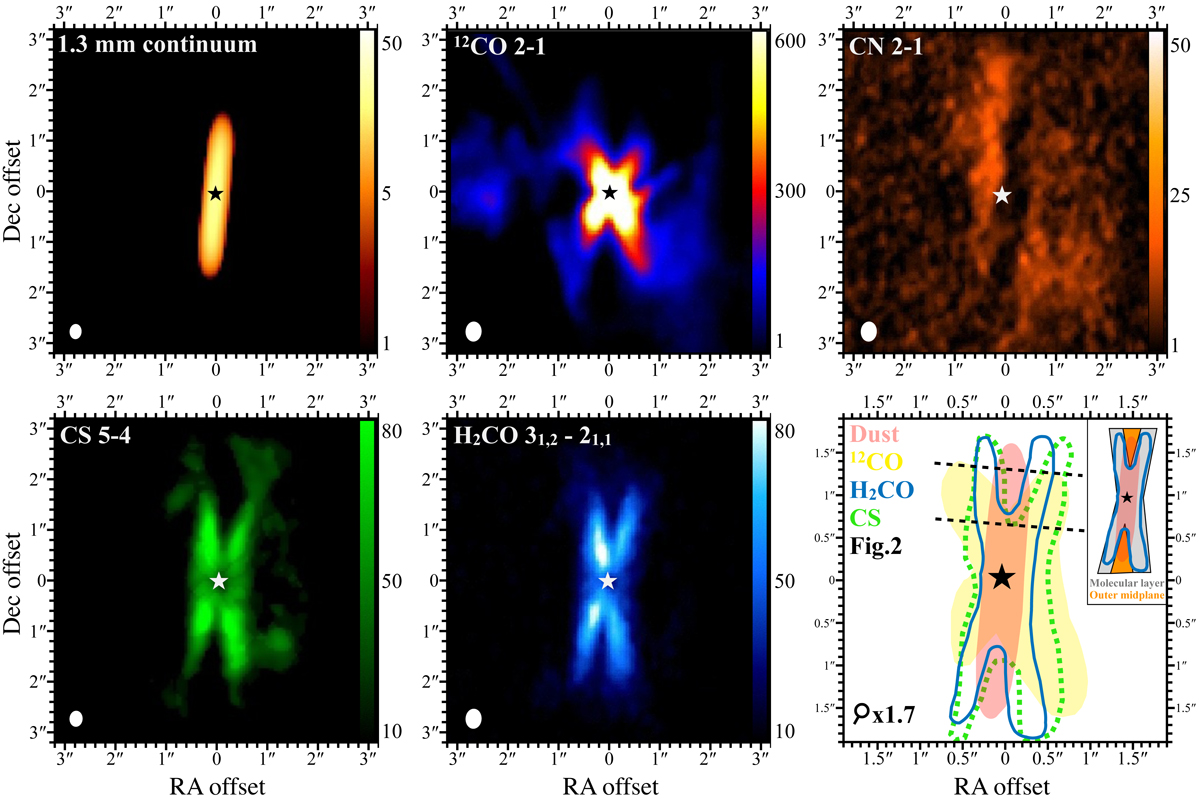
Moment 0 maps of continuum at 1.3 mm and molecular emission toward IRAS 04302+2247. Molecular lines are the CO 2−1, CN 2−1, CS 5−4, and H2CO 31, 2 − 21, 1. In each panel: the color wedge on the right shows the intensity in units of mJy beam−1 and in logarithmic scale for the continuum, and in units of mJy beam−1 km s−1 and linear scale for the lines. The star in the center indicates the geometrical center of the continuum emission. The beam size is shown at the bottom left. The sketch in the bottom-right panel shows the comparison between the continuum (dust) and molecular emission, and it is zoomed in by a factor of 1.7. The black-dashed lines indicate the section over which the vertical profiles of Fig. 2 are obtained. The inset shows the regions named the molecular layer and outer midplane (see Sect. 3.3). North is up, east is left.
Current usage metrics show cumulative count of Article Views (full-text article views including HTML views, PDF and ePub downloads, according to the available data) and Abstracts Views on Vision4Press platform.
Data correspond to usage on the plateform after 2015. The current usage metrics is available 48-96 hours after online publication and is updated daily on week days.
Initial download of the metrics may take a while.