Fig. 10.
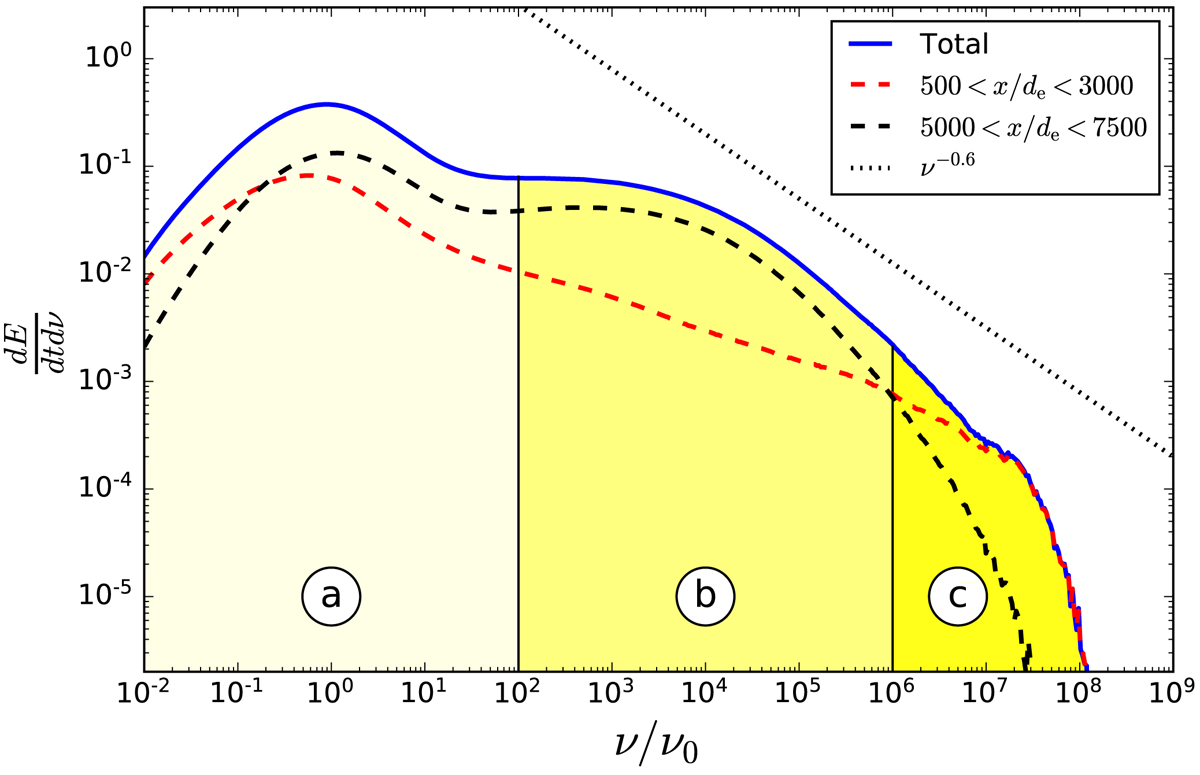
Total synchrotron spectrum for σ0 = 30 at ωpet = 7840 (blue solid line). The dashed lines show the spectra emitted near the shock front (red) and in the far-downstream region (black). The dotted line is a pure power law which would be emitted by a p = 2.2 power-law electron spectrum, such that dE/dtdν ∝ ν( − p + 1)/2 = ν−0.6. The frequency bands labeled ⓐ, ⓑ, and ⓒ refer to Fig. 11.
Current usage metrics show cumulative count of Article Views (full-text article views including HTML views, PDF and ePub downloads, according to the available data) and Abstracts Views on Vision4Press platform.
Data correspond to usage on the plateform after 2015. The current usage metrics is available 48-96 hours after online publication and is updated daily on week days.
Initial download of the metrics may take a while.