Fig. 6
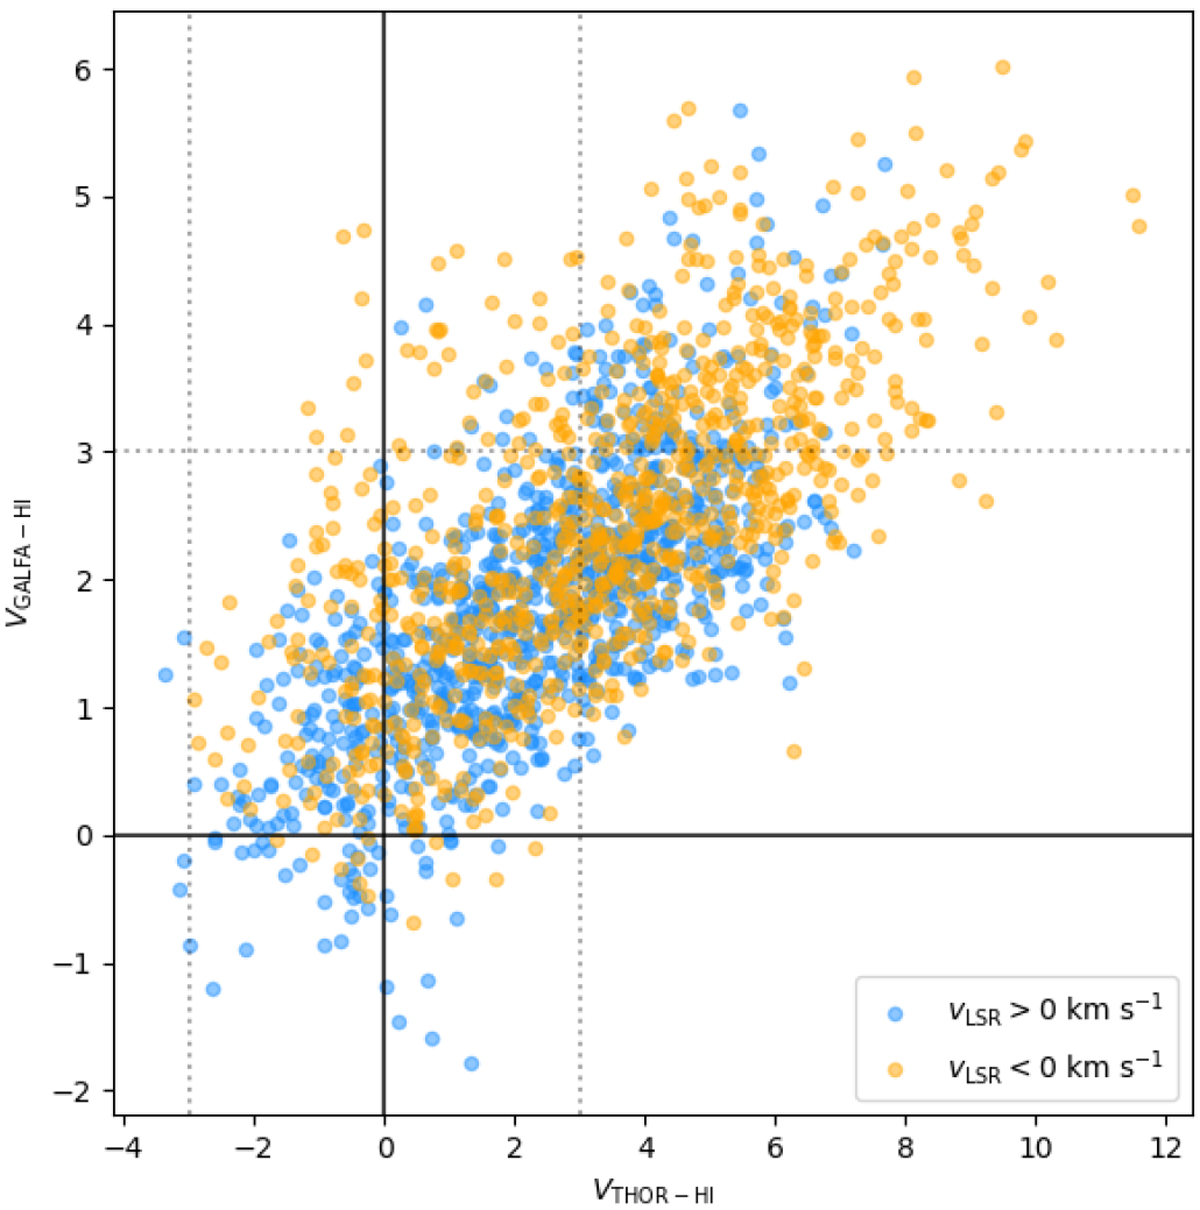
Projected Rayleigh statistic V calculated from Hessian analysis of the THOR-HI and GALFA-HI observations using a 120′′ FWHM derivative kernel. Each point corresponds to a 2° × 2° × 1.5 km s−1 velocity-channel tile fully covered by both surveys. The vertical and horizontal dotted lines indicate |V | = 3, which roughly corresponds to a 3-σ confidence level in the estimation of a preferential orientation of 0° or 90°. The difference in the range of V is the result of the larger significance obtained with the higher-resolution observations.
Current usage metrics show cumulative count of Article Views (full-text article views including HTML views, PDF and ePub downloads, according to the available data) and Abstracts Views on Vision4Press platform.
Data correspond to usage on the plateform after 2015. The current usage metrics is available 48-96 hours after online publication and is updated daily on week days.
Initial download of the metrics may take a while.