Fig. C.4
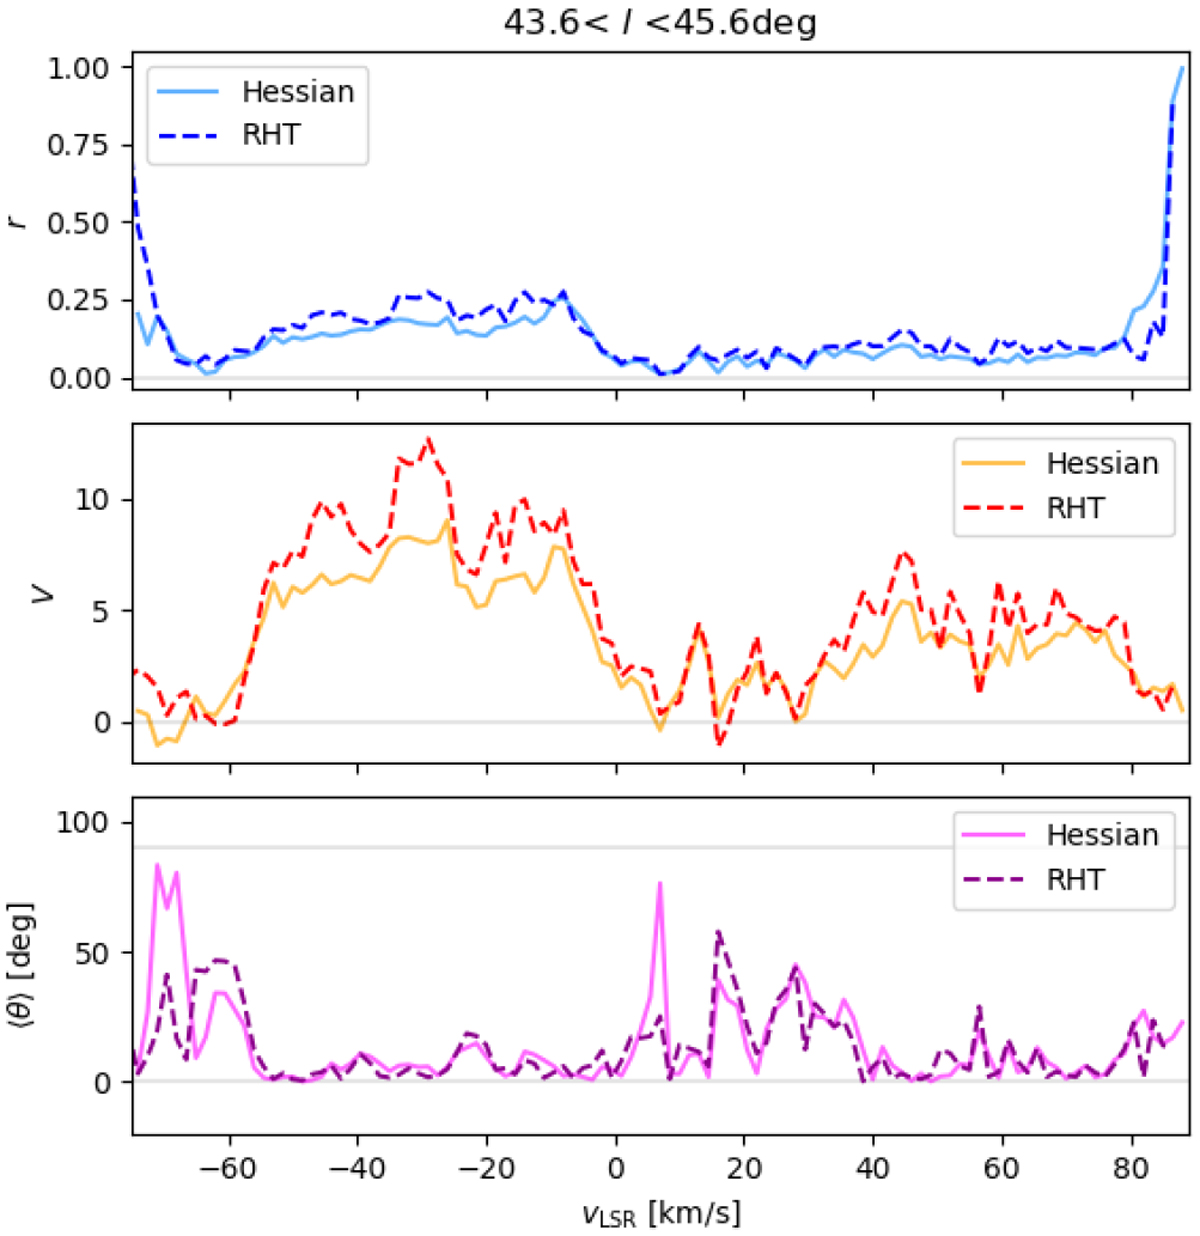
Circular statistics used for the study of the orientation of the HI filamentary structures found using the Hessian and the RHT methods across velocity channels toward the region presented in Fig. C.2. Top: mean resulting vector (r), which indicates if the distribution of orientation angles is flat (r ≈ 0) or sharply unimodal (r ≈ 1). Middle: projected Rayleigh statistic (V), which indicates if the distribution of orientation angles is clearly peaked around 0° (V ≫ 0) or 90° (V ≪ 0). Bottom: mean orientation angle (![]() ) of the HI filamentary structures.
) of the HI filamentary structures.
Current usage metrics show cumulative count of Article Views (full-text article views including HTML views, PDF and ePub downloads, according to the available data) and Abstracts Views on Vision4Press platform.
Data correspond to usage on the plateform after 2015. The current usage metrics is available 48-96 hours after online publication and is updated daily on week days.
Initial download of the metrics may take a while.