Open Access
Fig. C.2
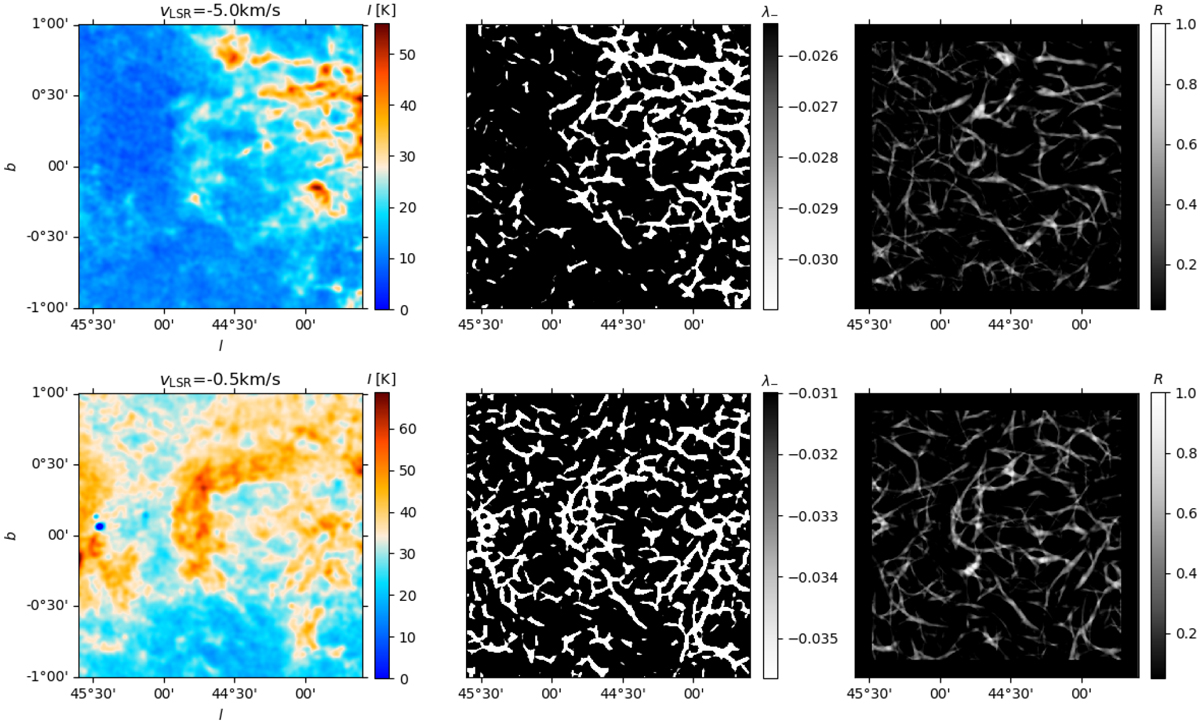
Comparison of the results of the Hessian and the RHT methods for two different velocity-channel maps toward a region within the area covered by THOR-HI. Left: intensity map at the indicated line-of-sight velocity, vLSR. Middle: mapof the eigenvalue λ− of the Hessian matrix. Right: map of the RHT backprojection.
Current usage metrics show cumulative count of Article Views (full-text article views including HTML views, PDF and ePub downloads, according to the available data) and Abstracts Views on Vision4Press platform.
Data correspond to usage on the plateform after 2015. The current usage metrics is available 48-96 hours after online publication and is updated daily on week days.
Initial download of the metrics may take a while.